Figures & data
Figure 1. Protein-ligand docking analysis: best binding poses for 3 and 4. Both compounds show a similar arrangement in their lowest energy poses, with a shifted NBD moiety and the benzoyl terminal making extensive contact with Phe 8. Crystal position for 1 is shown in red lines for reference, GST is shown in surface representation, with contributions coming from Phe 8 in orange (also shown in sticks) and those from Helix 2 in blue. GSH is also shown in sticks representation.
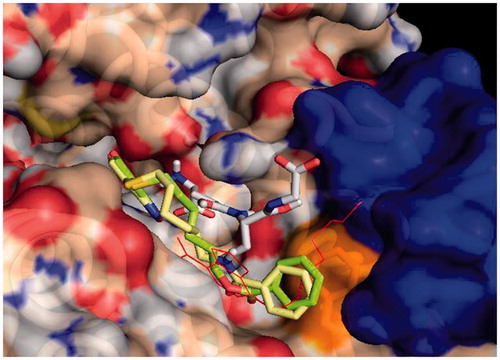
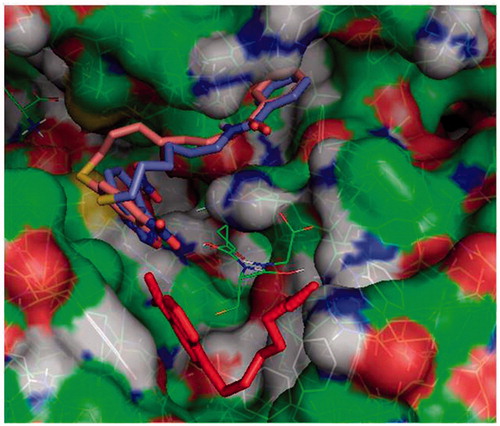
Figure 2. Protein-ligand docking analysis: alternative binding mode for 3 and 4. Both 3 (brick) and 4 (purple) exhibit a higher energy alternative binding pose which stretches toward the other monomer of GST. Compound 1 crystal position is shown in red sticks for reference and GSH is indicated in lines.
Scheme 1. Preparation of compound 4. (a) Benzoyl chloride, N,N-diisopropylethylamine, dry DCM, N2, 0 °C to rt; (b) 4-chloro-7-nitrobenzofurazane, pyridine, ethanol/water 1:1, N2, rt.
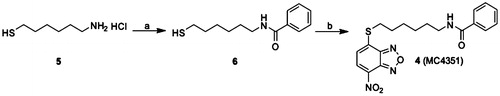
Figure 3. Spectrophotometric analysis. Structures and UV–visible spectra of 3 and 4 (20 µM), dissolved in buffer A, pH 7.4. Both spectra were recorded at 25 °C.
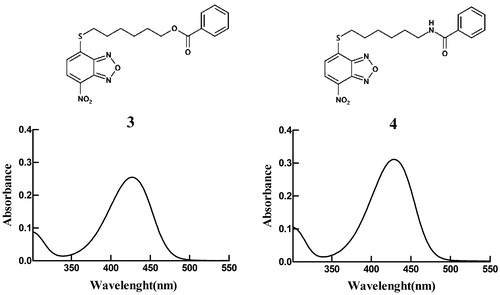
Table 1. Molecular weights, extinction coefficients and solubility limits.
Figure 4. Spontaneous reactivity of compounds 1–4 towards GSH. Each NBD derivative (10 µM) was incubated with 1 mM GSH in 0.1 M potassium phosphate (pH 7.4) at 37 °C for different time intervals. The data are expressed as percentage of compound remaining at each time compared with time 0 min, and represent the mean ± SD of three independent determinations. Error bars smaller than the symbols are not visible.
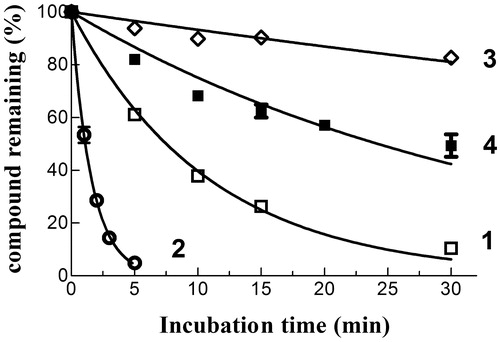
Figure 5. Inhibition of GTP1-1 conjugation activity. Inhibition of GSTP1-1 by 3 and 4 was evaluated at 25 °C. The assay mixture contained 1 mM GSH, and 1 mM CDNB in 1 mL of buffer B (0.1 M potassium phosphate buffer, pH 6.5, containing 0.1 mM EDTA). Data points represent the mean ± SD from three independent experiments. Error bars smaller than the symbols are not visible.
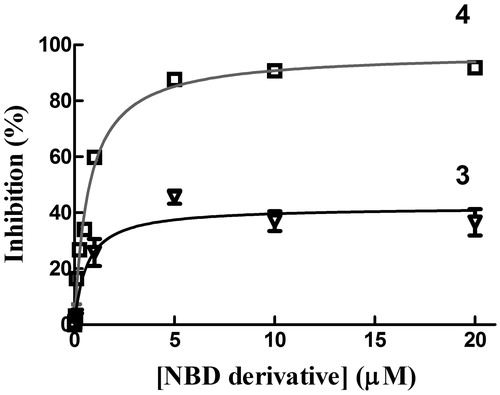
Table 2. GSTP1-1 and cell growth inhibition data.
Figure 6. Inhibition of the TRAF2-GSTP1-1 interaction. (A) His-tagged TRAF2 (0.005 µM) was immobilised on Ni-NTA-coated plates and incubated at pH 7.0 with increasing amounts of GSTP1-1 (from 0.1 to 2 µM) in the absence (-■-) or in the presence of compounds 1 (-□- 20 µM), 3 (-^- 20 µM) or 4 (-●- 20 µM). (B) The same experiments were repeated also in the presence of GSH (1 mM). In this case, the binding trend of 1 overlaps those obtained with 3 and 4. Data points represent the mean ± SD from three independent experiments. Error bars smaller than the symbols are not visible.
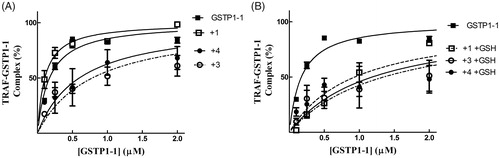
Figure 7. Assessment of metabolic stability of compounds 3 and 4 in human liver microsomes (HLMs). Compound 3 (panel A) or 4 (panel B) was incubated with pooled, mixed-gender HLMs (0.05 mg of protein/mL) in 0.1 M potassium phosphate buffer, pH 7.4 (-•-) or buffer only (-□-) at 37 °C for various time intervals (n = 5). The final concentration of each NBD derivative in the incubation mixture was 10 µM. To evaluate the role of CES on depletion of 3 in human liver microsomal incubations, the NBD derivative (10 µM) was incubated at 37 °C with pooled, mixed-gender HLMs (0.05 mg of protein/mL) in 0.1 M potassium phosphate buffer (pH 7.4) for 0 and 10 min, both in the absence and in the presence of 50 µM benzil (panel C). The data are expressed as percentage of compound remaining at each time compared with time 0 min, and represent the mean ± SD of three independent determinations. Error bars smaller than the symbols are not visible. ***P < 0.001 vs. control (minus benzil) at 10 min.
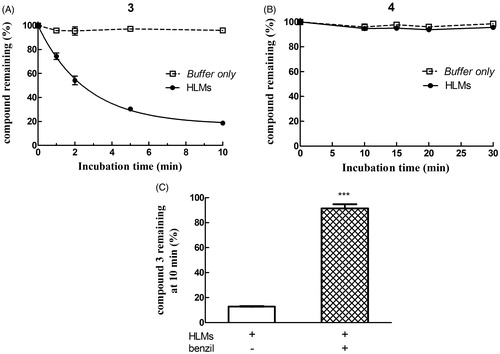
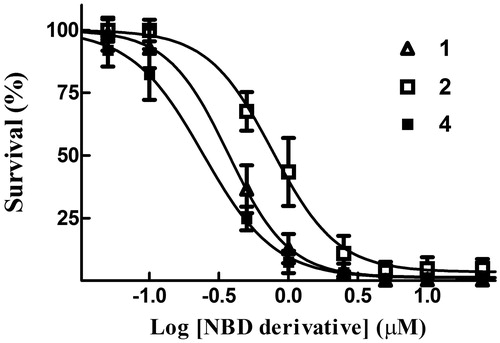
Figure 8. Cytotoxicity assay. Dose–response curves were obtained from human melanoma A375 cells treated with graded concentrations of compounds 1, 2 and 4. After 48 h of treatment, cell growth was evaluated by the SRB assay and expressed as a percentage of the control values. Data represent the mean ± SD of three independent determinations. The dose–response profiles allowed the calculation of the IC50 values reported in .