
Figures & data
Scheme 1. Synthesis of glycinediamide derivatives, reagents and conditions. (i) Na2CO3, DCM/H2O, HCl, 0 °C, r.t, Ph 2, 4 h. (ii) EDCI, HOBt, TEA, DCM, amine,16 h. (iii) 10% TFA in DCM. (V)EDCI, HOBt, TEA or DMAP, 16 h.
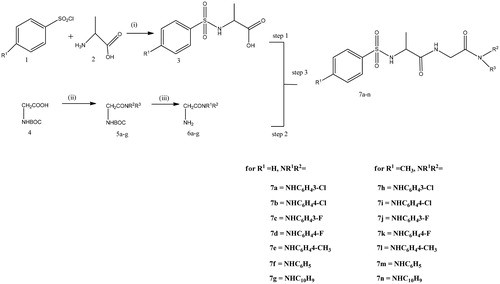
Table 1. Physicochemical properties of the synthesized compounds.
Table 2. Free binding energy (ΔG, kcal/mol) of compounds.
Figure 1. A stereoview showing the active site of the 7g-2Y2G complex. 7g is shown in ball-and-stick model (orange). The amino acids are shown as lines (black). Hydrogen and π-H bonds between 7g and the protein are shown as green and purple dotted lines, respectively.
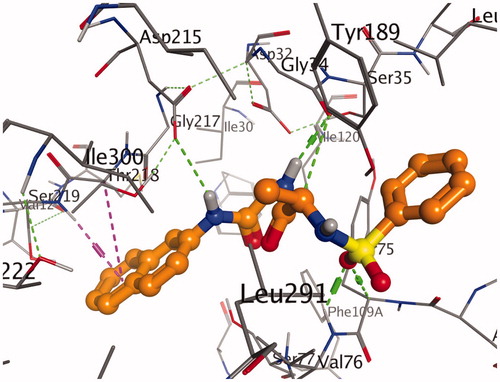
Figure 2. Representation of the chemical interactions of 7g with the amino acid residues of 3QS1.
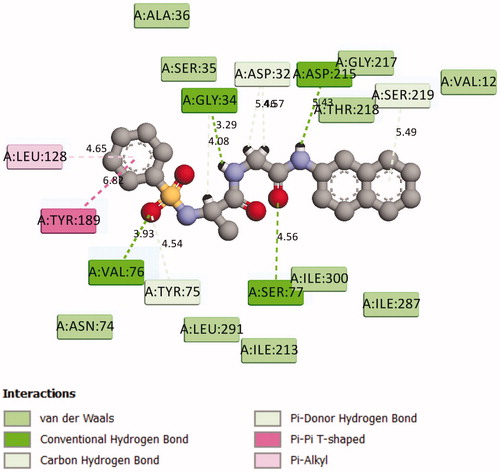
Figure 3. 2D Representation of the chemical interactions of 7a with the amino acid residues of 1SME.
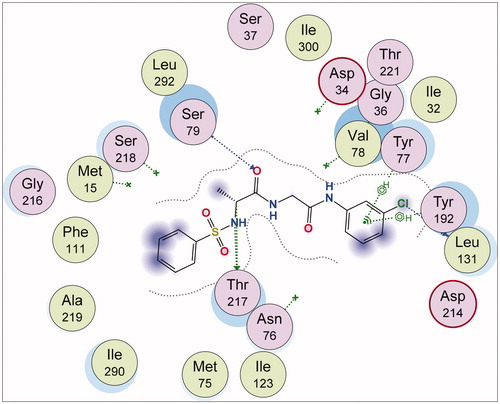
Figure 4. A stereoview showing the active site of the 7g-2Y2G complex. 7g is shown in ball-and-stick model (orange). The amino acids are shown as lines (black). Hydrogen and π-H bonds between 7g and the protein are shown as green and purple dotted lines, respectively.
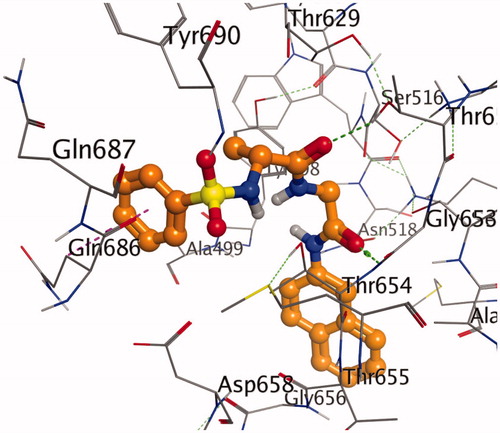
Figure 5. Representation of the chemical interactions of 7g with the amino acid residues of 2Y2G.
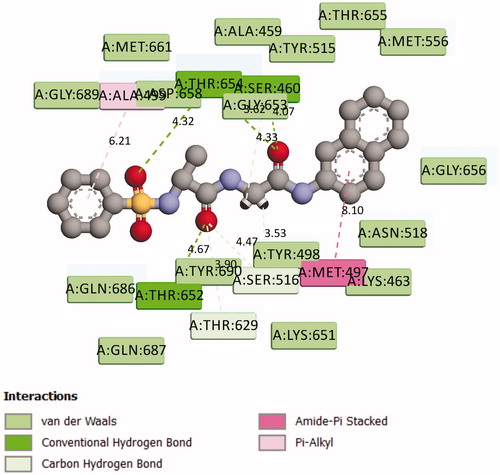
Figure 6. 2D Representation of the chemical interactions of 7n with the amino acid residues of 5MMN.
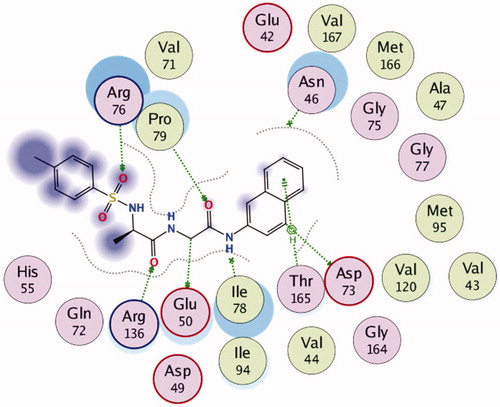
Table 3. MIC (minimum inhibitory concentration) mg/ml.
Table 4. In vitro antimalarial study.
Table 5. Percentage inhibition of parasite in mice.
Table 6. Liver function test.
Table 7. Kidney function test.
Table 8. Heamotological analysis before and after treatment.