Figures & data
Figure 1. (a) Molecular properties of the pharmacophore for the inhibition of the hMAOs. The part of the structure shown in red corresponds to the chalcone moiety (adapted from referenceCitation13); (b) Structure of aurone (I) and indanone (II) derivatives; (c) Benzo[b]thiophen-3-ol scaffold: similarities and differences with previously reported compounds.
![Figure 1. (a) Molecular properties of the pharmacophore for the inhibition of the hMAOs. The part of the structure shown in red corresponds to the chalcone moiety (adapted from referenceCitation13); (b) Structure of aurone (I) and indanone (II) derivatives; (c) Benzo[b]thiophen-3-ol scaffold: similarities and differences with previously reported compounds.](/cms/asset/3829c2d6-bff4-48bc-9a33-61598d45af18/ienz_a_1653864_f0001_c.jpg)
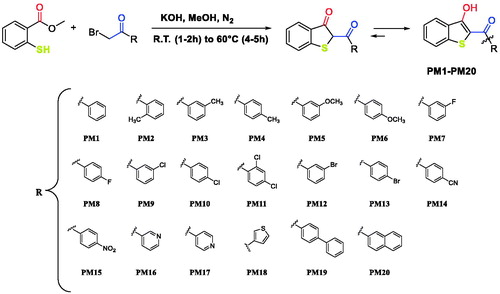
Scheme 1. Synthesis of compounds PM1-PM20.
Scheme 2. Proposed mechanism of reaction.
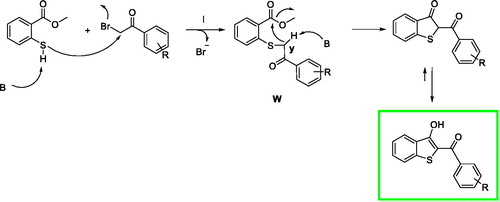
Table 1. Inhibitory activity (IC50) and selectivity index (SI) of compounds PM1-PM20 towards hMAO-A and hMAO-B.
Figure 2. Effect of the PM series of inhibitors on DOPAC/DA ratio in rat cortex synaptosomes. ANOVA: p<.0001; post-hoc: ***p<.001 vs. vehicle group. All the compounds and deprenyl were tested at the same concentrations: 20 nM, 0.1 μM, and 1 μM.
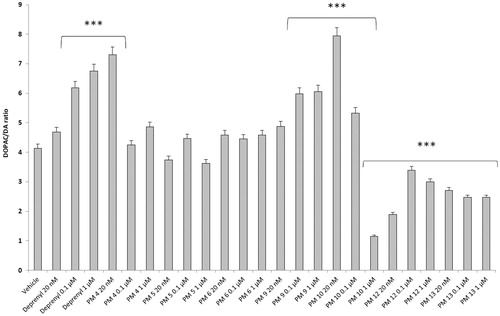
Figure 3. Effect of the PM series of inhibitors on DOPAC/DA ratio in rat cortex synaptosomes challenged with LPS. ANOVA: p<.0001; post-hoc: *p<.05, ***p<.001 vs. LPS group. All the compounds and deprenyl were tested at the same concentrations: 20 nM, 0.1 μM and 1 μM.
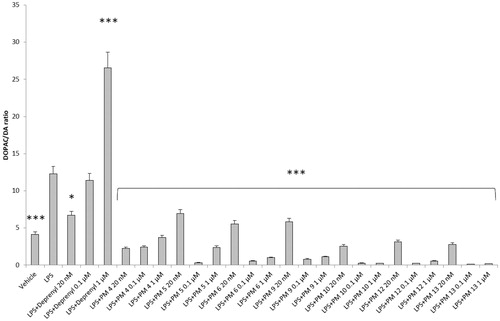
Figure 4. Effect of the PM series of inhibitors on LDH activity in rat cortex synaptosomes. ANOVA: p<.0001; post-hoc: *p<.05, **p<.01, ***p<.001 vs. vehicle group. All the compounds and deprenyl were tested at the same concentrations: 20 nM, 0.1 μM, and 1 μM.
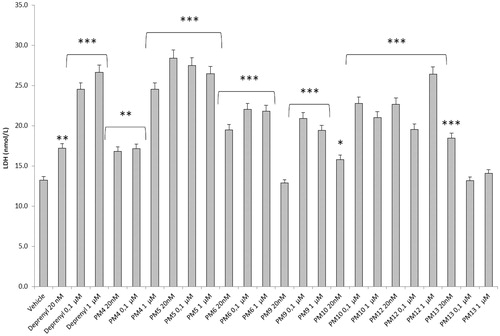
Figure 5. Effect of the PM series of inhibitors on LDH activity in rat cortex synaptosomes challenged with LPS. ANOVA: p<.0001; post-hoc: *p<.05, **p<.01, ***p<.001 vs. LPS group. All the compounds and deprenyl were tested at the same concentrations: 20 nM, 0.1 μM, and 1 μM.
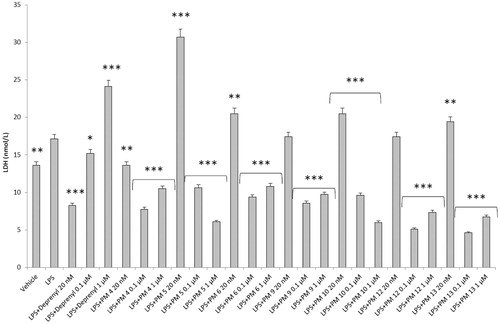
Table 2. IC50 values in the antioxidant assays (mM).
Figure 6. 2 D structures of the conformers/tautomers investigated by quantum-mechanics approach for each compound reported in .
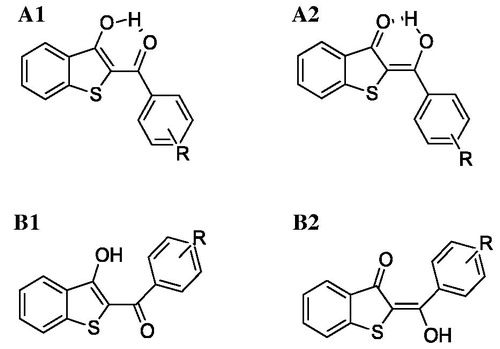
Table 3. Theoretical interaction energy and its van der Waals (vdW) and Coulomb (Coul) components are reported (in kcal/mol) for each ligand-target complex.
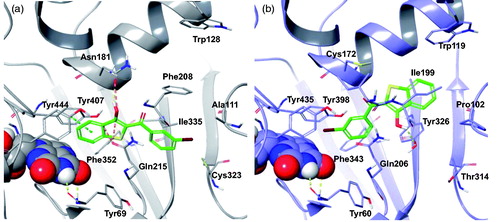
Figure 7. The most stable binding modes of PM12 in the (a) hMAO-A and (b) hMAO-B active sites, represented in grey and lilac colouring, respectively. The ligand is depicted in polytube with the carbons coloured green, the FAD cofactor is displayed in space fill and the most relevant ligand interacting amino acids are shown as thin tubes. Yellow, light blue, and orange dotted lines represent inter-molecular hydrogen bonds, π–π interactions and unfavourable contacts, respectively.