Figures & data
Figure 1. The chemical structures of acetazolamide, methazolamide and ethoxzolamide.
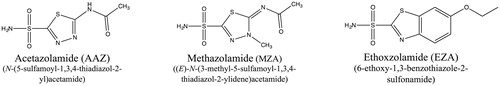
Table 1. Sensitivity profiles of H. pylori clinical isolate strains CH425, CH426, and CH427 to clinically used antibiotics.
Table 2. MIC and MBC values of three sulphonamide drugs against four laboratory strains and three clinical isolates.
Figure 2. The antimicrobial effects of carbonic anhydrase inhibitors EZA, AAZ, and MZA on various H. pylori strains. Sensitivity of the laboratory strains P12, 26695, SS1, and J99 to (A) EZA, (C) AAZ, and (E) MZA and sensitivity of the clinical strains CH425, CH426, CH427 to (B) EZA, (D) AAZ, and (F) MZA are represented as percentage survival after 24 h (CFU survival (%)=(CFU24h/CFU0h)*100). The CFU survival levels corresponding to MIC (100.1% survival), MBC (0.1% survival) and limit of detection (LOD) are indicated by horizontal lines. Error bars represent the standard error of the mean for three independent biological replicates.
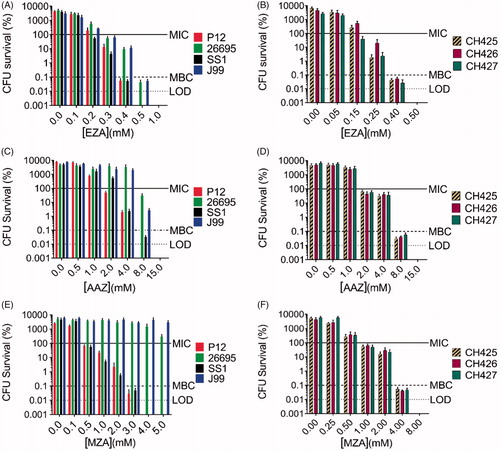
Figure 3. Analysis of the time and dose dependency of the antimicrobial action of AAZ, MZA, and EZA on H. pylori P12. (A) Bactericidal kinetics for 1 × MBC and 2 × MBC of the respective sulphonamide, measured at neutral pH (B) Bactericidal kinetics for 2 × MBC of the respective sulphonamide under neutral (pH 6.8) and acidic (pH 4.5) conditions. The horizontal dashed line represents the limit of detection (100 cells) and the horizontal solid line corresponds to 99.9% cell death. Error bars represent the standard error of the mean for three independent biological replicates.
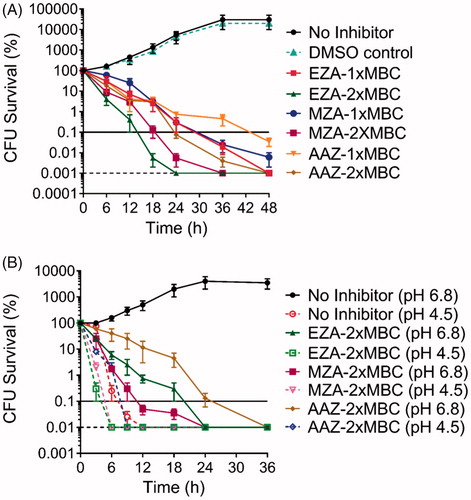
Figure 4. Growth curves for H. pylori P12 WT and MutE measured over 36 h. Error bars represent the standard error of the mean for three independent biological replicates. Significant differences compared to wild type P12 are indicated; *p < .05, **p < .01. All other differences are not significant.
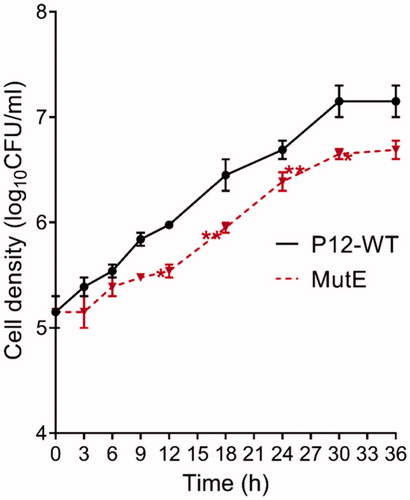
Table 3. Nucleotide changes in H. pylori P12 EZA-resistant mutants generated by transformation of WT P12 with MutE chromosomal DNA.
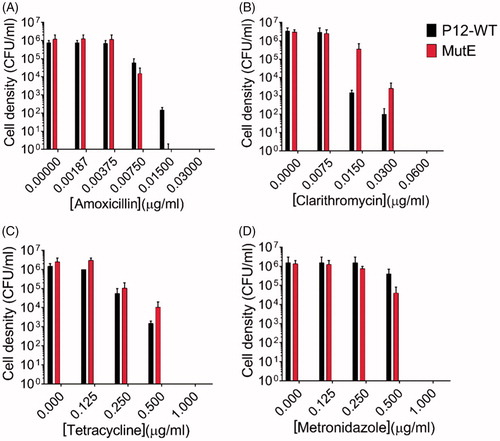
Figure 5. Sensitivity of H. pylori P12 WT and its sulphonamide-resistant mutants MutE to clinically used antibiotics amoxicillin, clarithromycin, tetracycline, and metronidazole. Error bars represent the standard error of the mean for two independent biological replicates. (A) The MIC values of both the WT strain and MutE for amoxicillin were 0.0075 µg/ml, with the MBC value for MutE (0.015 µg/ml) being 2-fold lower than for the WT strain. (B) The P12 WT strain and MutE showed very close sensitivities to clarithromycin (MIC = 0.015 µg/ml, MBC = 0.06 µg/ml). (C) The sensitivity assay for tetracycline yielded the MIC and MBC values of 0.25 µg/ml and 1 µg/ml, respectively for both the WT strain and MutE. (D) The P12 WT strain and MutE showed the same sensitivity pattern for metronidazole (MIC = 0.5 µg/ml, MBC = 1 µg/ml).