Figures & data
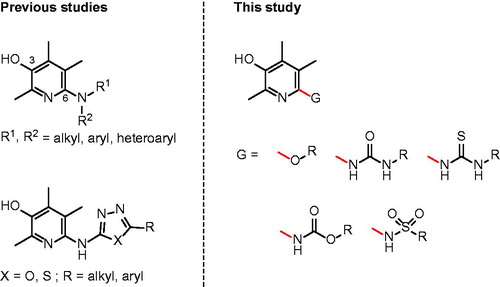
Figure 1. 2,4,5-Trimethylpyridin-3-ol as anti-IBD scaffold.
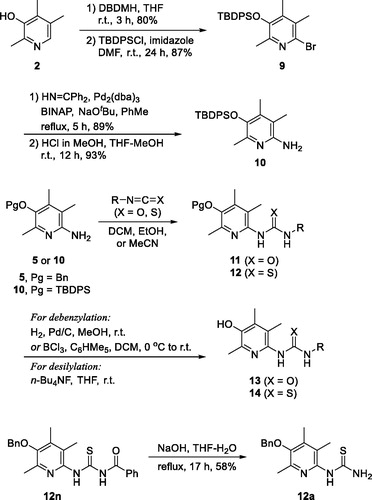
Scheme 1. Synthesis of alkoxy-analogues 8.
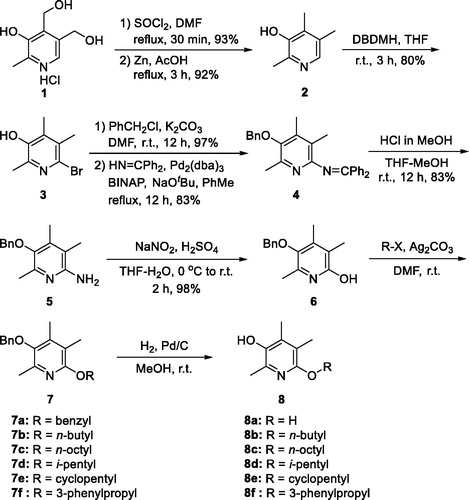
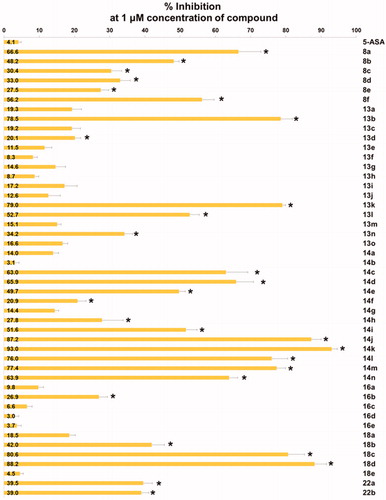
Figure 2. Inhibitory activity of the compounds against TNF-α-induced monocyte adhesion to colon epithelial cells. Data are shown as mean ± SEM of at least three independent experiments. *p < 0.05 compared to TNF-α-induced HT-29 cells.
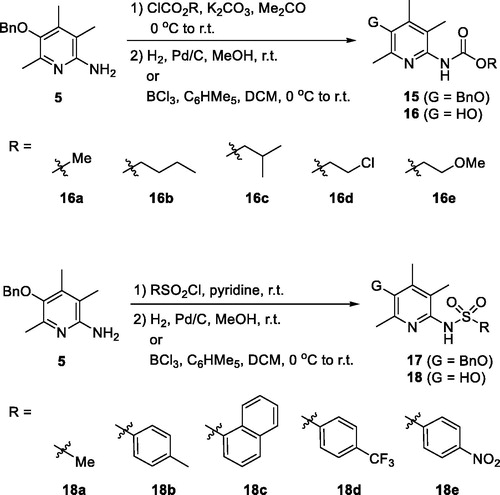
Scheme 3. Synthesis of carbamato- and sulfonamido- analogues, 16 and 18.
Scheme 4. Synthesis of 3-methoxy analogues, 22.
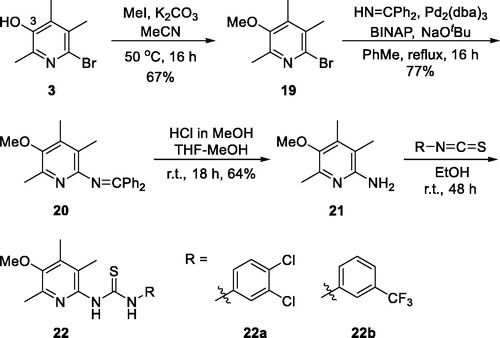
Figure 3. Recovery effects of compounds on TNBS-induced rat colitis, body and colon weights, and MPO activity. Colitis was induced by rectal administration of TNBS, and sham group received vehicle (50% ethanol) in the same route. Compounds (1 mg/kg) and SSZ (300 mg/kg) were given orally 1 day after TNBS treatment. Data represent the mean ± SEM for five rats per group. (A) Body weight was recorded daily from day 0 to day 5, and body weight recovery was calculated based on the last day measurement. Colon wet weight (distal 5–6 cm segment) was measured right after dissection of the colon. #p < 0.05 compared to TNBS-treated group. $p < 0.05 compared to SSZ-treated group. (B) MPO level of colon tissues *p < 0.05 compared to sham-operated control group. #p < 0.05 compared to TNBS-treated group.
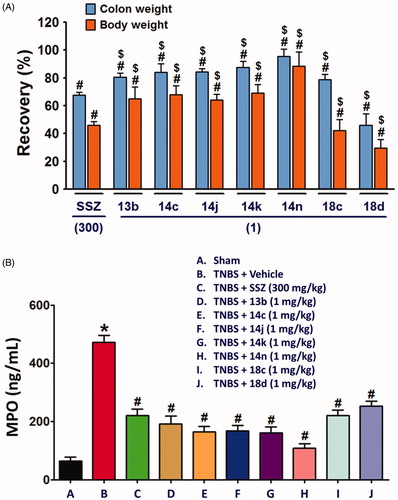
Figure 5. NLRP3 inflammasome formation in TNBS-treated rat colon was suppressed by the compounds. Total protein extracts from colon tissue homogenates were used for detection of NLRP3 inflammasome components. The bar graphs represent the mean ± SEM of protein expression quantified in three independent experiments. *p < 0.05, compared with vehicle-treated control group. #p < 0.05, compared with the TNBS-treated group.
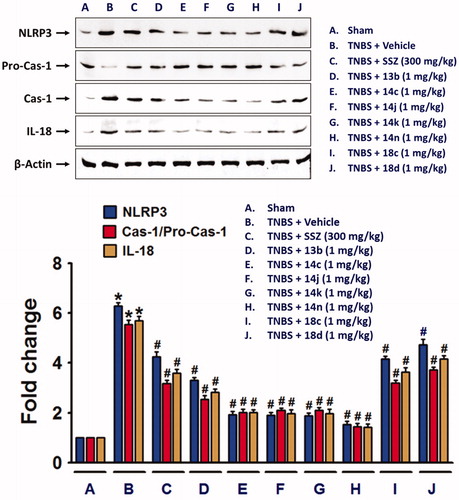
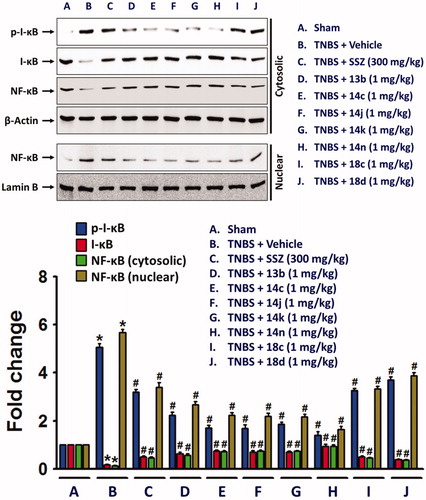
Figure 6. Inhibitory effects of the compounds on the nuclear translocation of NF-κB in along with increase in cytosolic phospho-I-κB. Cytosolic and nuclear proteins extracted from colon tissue homogenates were used for detection of phospho-I-κB, I-κB, and NF-κB. The bar graphs represent the mean ± SEM of protein expression quantified in three independent experiments. *p < 0.05, compared with vehicle-treated control group. #p < 0.05, compared with the TNBS-treated group.