Figures & data
Figure 1. Schematic illustration of the methods involved in the construction of the model for the virtual screening. The progress of the investigation is described as a cyan circle in each step of the molecular modelling.
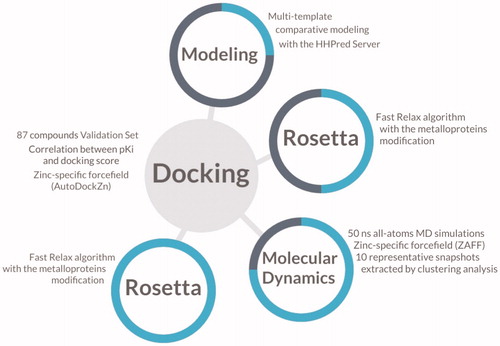
Table 1. Values of the parameters achieved in the structure quality evaluation of the different models of TcCA.
Figure 2. Final model of TcCA achieved from multi-template comparative modelling and subsequent iterative Rosetta-MD refinement. Histidine residues of the active site are highlighted in green for carbon atoms and in blue for nitrogen atoms. The zinc ion is represented as a non-bonded sphere in grey.
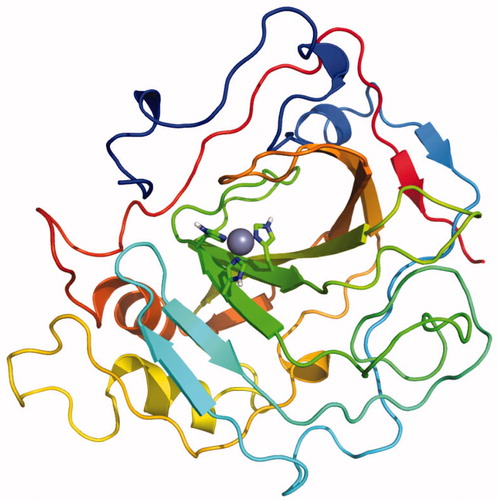
Figure 3. Pearson’s R obtained from docking the validation set on every refined MD snapshot. The white dot represents the median value, and the black line height represents the distance between the lower quartile (Q1) to the upper quartile (Q3), which is called the interquartile range (IQR). Violin plots show the probability density of the data at different values as a kernel density estimation.
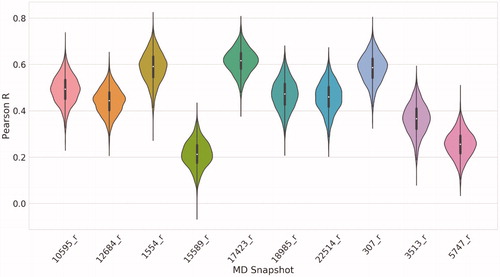
Figure 4. ROC curve obtained for the final model applied in the virtual screening.
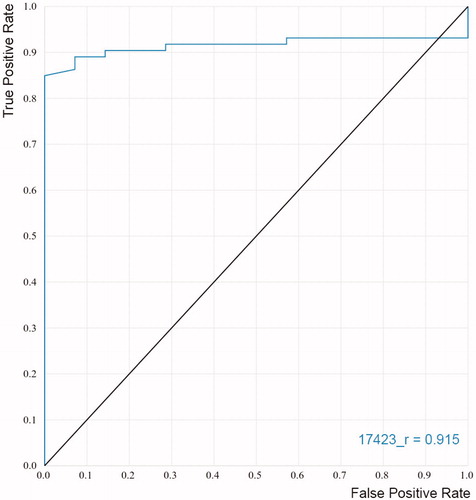
Figure 5. Candidates selected from the virtual screening.
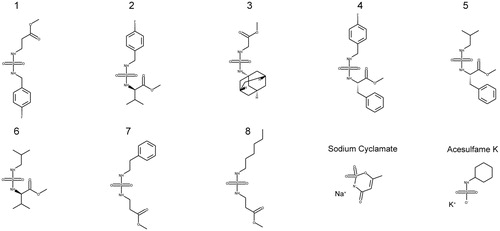
Table 2. Biological data and docking scores achieved for compounds of the set.
Figure 6. (A) Best docking solution for the interaction of compound 5 within the active site of TcCA. Histidine and important residues of the active site are highlighted in grey for carbon atoms, in red for oxygen atoms and in blue for nitrogen atoms. The zinc ion is represented as a non-bonded sphere in cyan. Colour code for compound 5: Carbon atoms in green, Nitrogen atoms in blue, sulphur atoms in yellow and oxygen atoms in red. (B) Schematic representation of the interactions between compound 5 and the active site of the TcCA model.
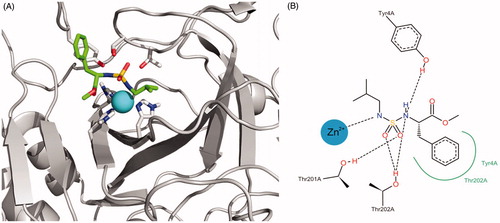
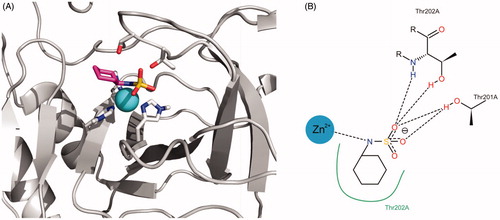
Figure 7. (A) Best docking solution for the interaction of cyclamate with the active site of TcCA. Histidine and important residues of the active site are highlighted in grey for carbon atoms, in red for oxygen atoms and in blue for nitrogen atoms. The zinc ion is represented as a non-bonded sphere in cyan. Colour code for cyclamate: Carbon atoms in violet, Nitrogen atoms in blue, sulphur atoms in yellow and oxygen atoms in red. (B) Schematic representation of the interactions between cyclamate and the active site of the TcCA model.