
Figures & data
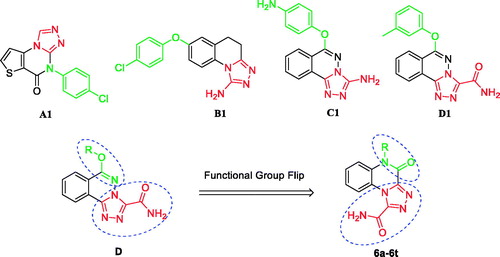
Figure 1. Design of target compounds 6a–6t.
Scheme 1. Reagents and conditions: (a) oxalic acid, HCl/H2O, 100 °C, 2 h; (b) Hydrazine hydrate, 100 °C, 2 h; (c) Diethyl oxalate, reflux, 3 h; (d) RX, K2CO3, DMF, 60 °C, 3 h; (e) NH3·H2O, methanol, r.t., 2 h.
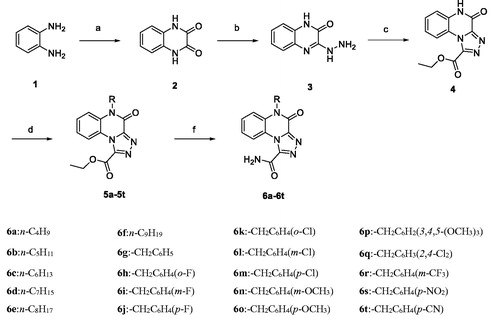
Table 1. Effect of compounds 6a–6t on the viability of RAW264.7 cells.
Figure 2. RAW264.7 cells were pre-cultured for 24 h, the cells were then treated with the indicated concentrations of compounds for 30 min, and then exposed to 1 μg/mL LPS for 24 h. The levels of NO in the culture medium were measured with NO assay kit. (A) Cells were treated with 10 μM compounds. Cells were pre-treated with different concentrations of compound 6p. NO, TNF-α and IL-6 levels in the medium were determined with an ELISA kit. (B, C and D). ### p < .01, vs. Control. *p < .05, **p < .01, ***p < .001 vs. LPS alone.
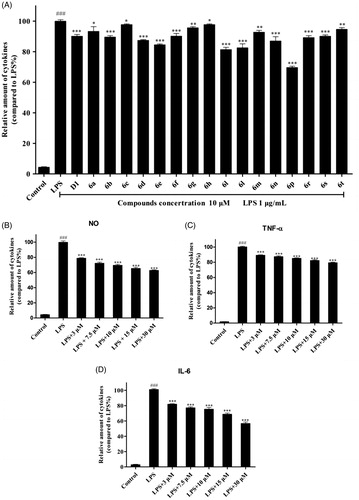
Figure 3. Compound 6p inhibited LPS-induced inflammatory response in RAW 264.7 cells. Cells were pre-treated with different concentrations of 6p (7.5–30 µM) and Celecoxib (7.5 µM) for 24 h. iNOS, COX-2 and GAPDH proteins expression were detected by Western blot analysis. Total cellular proteins were prepared and analysed by Western blotting. Results are the mean ± SD, n = 3. ### p < .001, vs. Control. *p < .05, **p < .01, ***p < .001 vs. LPS alone.
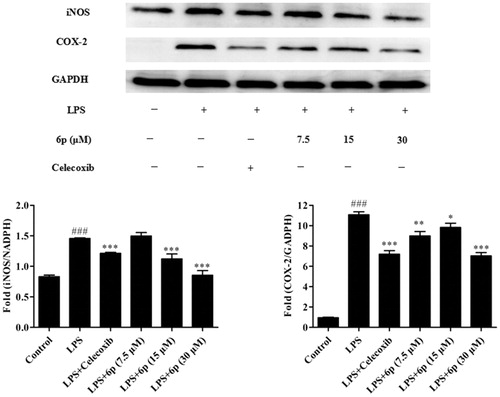
Figure 4. Compound 6p inhibited LPS-induced inflammatory response in RAW 264.7 cells. Cells were pre-treated with different concentrations of 6p (7.5–30 µM) and Celecoxib (7.5 µM) for 24 h. The levels of p-p38/P38, p-ERK/ERK, p-JNK/JNK and GAPDH proteins, and their phosphorylated forms were analysed using Western blotting. Total cellular proteins were prepared and analysed by Western blotting. Results are the mean ± SD, n = 3. ### p < .001, vs. Control. *p < .05, **p < .01, ***p < .001 vs. LPS alone.
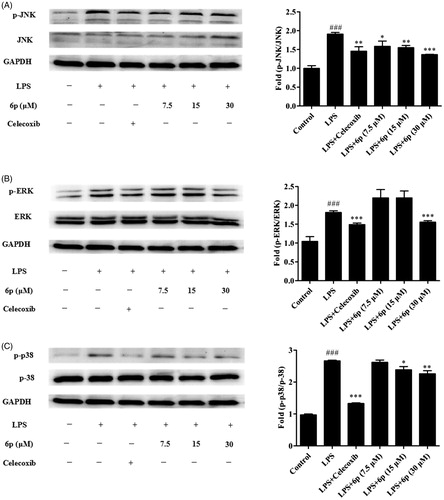
Figure 5. The inhibited paw swelling actives of lead compound D1, 6p and positive control drugs (25 mg/kg) in a carrageenan-induced mouse paw oedema model after 3 h of oral administration. **p < .01, vs. D1; ##p < .01, vs. Ibuprofen; $ p < .05, vs. Celecoxib.
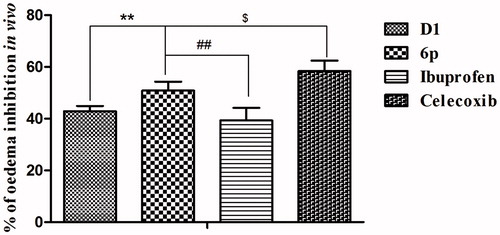
Table 2. The anti-inflammatory activity and ulcerogenic activity in vivo.