Figures & data
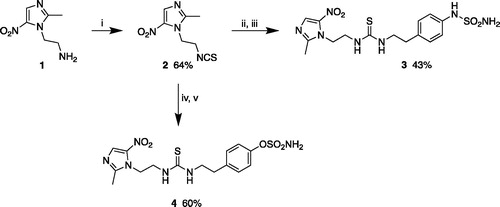
Scheme 1. Synthesis of thioureas 3 and 4. Reagents and conditions: (i) thiophosgene, NaOH, CHCl3, 0 °C-rt; (ii) 4-(2-aminoethyl) aniline, CH3CN, rt; (iii) NH2SO2Cl, DMA, rt; (iv) 4-(2-aminoethyl) phenol, CH3CN, rt; (v) NH2SO2Cl, DMA, rt.
Scheme 2. Synthesis of sulphonamide 10. Reagents and conditions: (i) CH3SO2Cl, NEt3, DMAP, DCM, 0 °C – rt; (ii) KSAc, DMF, rt; (iii) 35% H2O2-CH3COOH, rt; (iv) phosgene, cat. dry DMF, dry DCM, rt, (v) NH3 in 1,4 dioxane, benzene, rt.
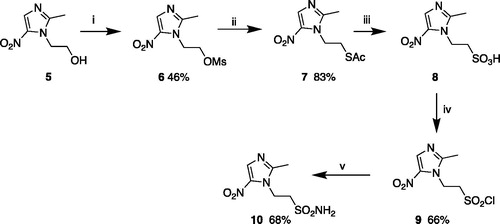
Table 1. Inhibition data of compounds 3, 4 and 10 against hCA I, hCA II and hCA IX using a stopped flow CO2 hydrase assay.
Figure 1. The LC50 values of the tested CA inhibitor compounds. The LC50 doses for the inhibitors were determined based on the 50% mortality of the larvae at the end of 5 d after the exposure of embryos to different concentrations of inhibitors: compound 3 (A), 4 (B) and 10 (C). The LC50 doses were determined after three independent experiments with similar experimental conditions (for each compound N = 90).
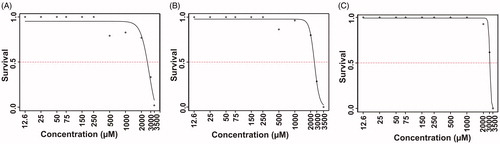
Figure 2. The images of zebrafish larvae in control and inhibitor treated groups. Representative images of 2–5 dpf zebrafish larvae exposed to different concentrations (75, 250 and 500 μM) of compound 3, 4 and 10. The images of control group (not treated with inhibitors) and 1% DMSO treated zebrafish larvae show normal development (n = 60).
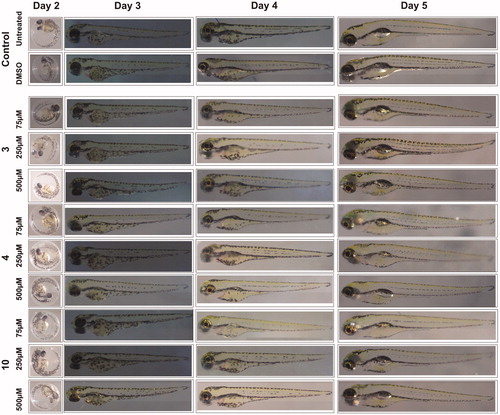
Figure 3. The effect of compounds 3, 4 and 10 CA inhibitors on the phenotypic parameters of the 5 dpf zebrafish larvae. The plot graphs of different phenotypic abnormalities in (A) hatching, (B) oedema, (C) heartbeat (D) body shape and (E) yolk sac utilisation. For each concentration, n = 90. *p < 0.05 by two-tailed Fisher’s test.
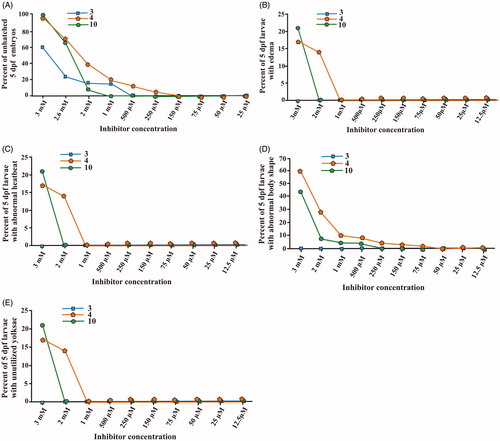
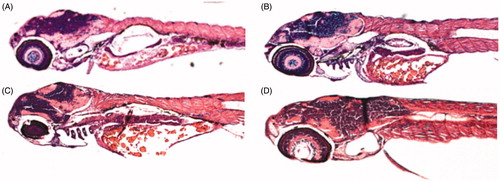
Figure 4. Histochemical analyses of zebrafish larvae. Representative sagittal sections of an untreated zebrafish larva (A) or larva treated with 500 μM of compound 3 (B), 4 (C) or 10 (D). The images presented here are selected from three independent groups of experiments.