Figures & data
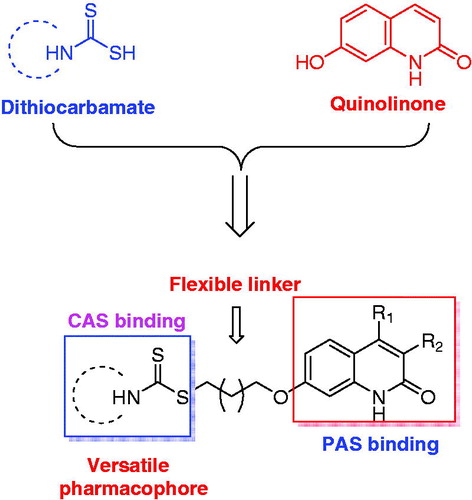
Figure 1. Rational design of quinolinone derivatives as multifunctional AChE inhibitors for the treatment of AD.
Scheme 1 Synthesis of compounds 4a-m and 9a-b. Reagents and conditions: (a) (i) cinnamoyl chloride, dry dichloromethane, 4 h, reflux; (ii) AlCl3, chlorobenzene, 8 h, reflux; (b) α, ω-dibromoalkanes, K2CO3, acetone, reflux, 4 h; (c) appropriate secondary amines, CS2, TEA, DMF, r.t., 12 h. (d) ethyl acetoacetate for 6a, ethyl 2-methylacetoacetate for 6 b, 150 °C, 48 h; (e) (i) NaNO2, H2SO4, 0 °C; (ii) 10 M, H2SO4, reflux, 10 min.
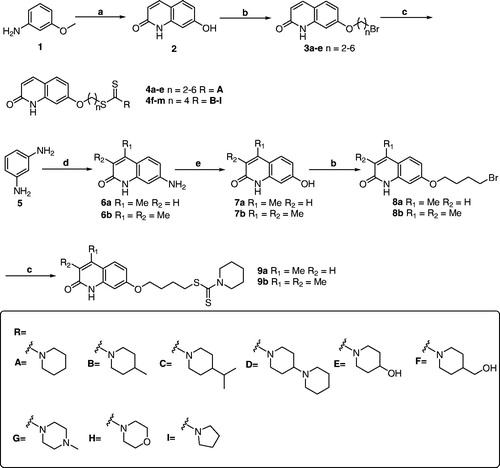
Table 1. Inhibition of eeAChE and eqBuChE by compounds 4a-m and 9a-b.
Figure 2. Lineal correlation between experimental and reported permeability of commercial drugs using the PAMPA-BBB assay. Pe (exp.) = 0.9082Pe(bibl.) – 0.3034 (R2 = 0.9410).
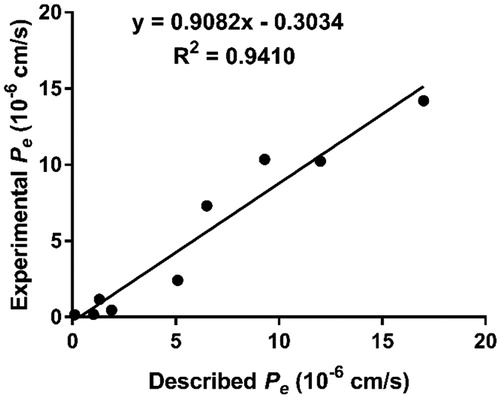
Table 2. Permeability Pe(×10−6) in the PAMPA-BBB assay for 9 commercial drugs in the experiment validation.
Table 3. Permeability Pe (×106 cm/s) in the PAMPA-BBB assay for target compounds and their predicted penetration into CNS.
Table 4. Inhibition of hAChE, and AChE- and self-induced Aβ1-42 aggregation by selected compounds.
Figure 3. Kinetic study on the inhibition mechanism of hAChE by compound 4c. (a) Overlaid Lineweaver-Burk reciprocal plots of hAChE initial velocity at increasing substrate concentrations (0.05–0.50 mM) in the absence of inhibitor and in the presence of different concentrations (0.4, 0.2 and 0.1 μM) of 4c are shown. (b) The plot of the slopes of the Lineweaver-Burk plots versus inhibitor concentration.
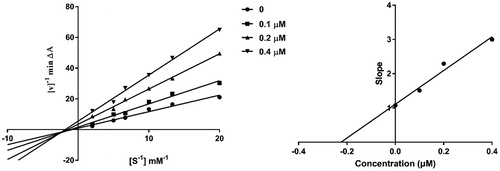
Figure 4. (a) 3 D docking model of compound 4c with hAChE. Atom colours: green-carbon atoms of 4c, gray-carbon atoms of residues of hAChE, dark blue-nitrogen atoms, red-oxygen atoms, yellow-sulfur atoms. (b) 2 D schematic diagram of docking model of compound 4c with hAChE. The figure was prepared using the ligand interactions application in MOE.
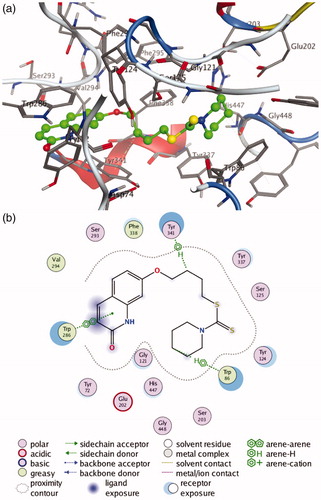
Figure 5. (a) 3 D docking model of compound 9b with Aβ1-42. Atom colours: green-carbon atoms of 9b, gray-carbon atoms of residues of Aβ, dark blue-nitrogen atoms, red-oxygen atoms, yellow-sulfur atoms. (b) 2 D schematic diagram of docking model of compound 9b with Aβ. The figure was prepared using the ligand interactions application in MOE.
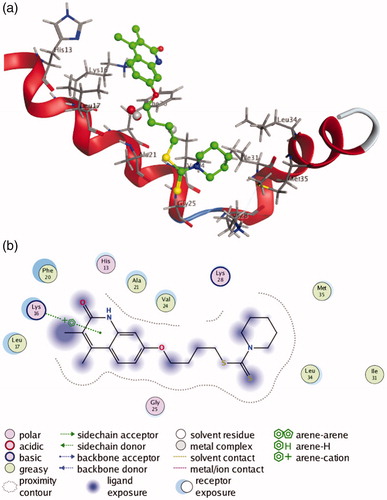
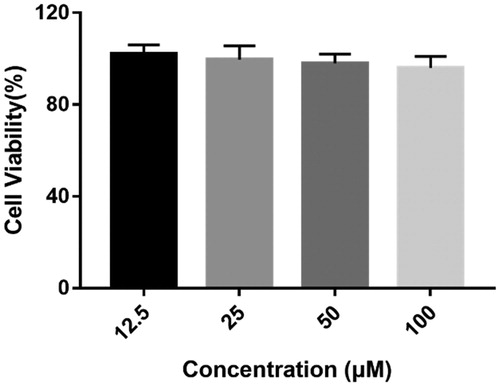
Figure 6. Cytotoxicity of compound 4c on human neuroblastoma cells SH-SY5Y. SH-SY5Y cells were incubated with different concentrations of compound 4c (12.5–100 µM) for 24 h. The results are shown as the percentage of viable cells after treatment with compound 4c vs untreated control cells. Date are expressed as mean ± SD from three independent experiments.