Figures & data
Figure 1. Statins induced a high percentage of petites production in yeast cells. (a) Percentage of petites production of wild type W303 and W303 rho° grown in YPD medium and wild type W303 grown in YPD medium with pravastatin 150 µg/ml, atorvastatin 100 µg/ml and rosuvastatin 50 µg/ml. (b) The petite phenotype is suppressed by ergosterol. The same statins treatments as in (a) didn’t show a petite phenotype production in cells grown in a medium supplemented with ergosterol (0,5 mg/ml, YPDE). Cultures grown 24, 48 and 72 hours were plated on YPD plates and petites were counted after a replica plating on glycerol containing medium. Data are the average of 3 independent experiments and standard deviation is indicated. The asterisks indicate significant modulations (p < 0.05) according to Student’s T-test.
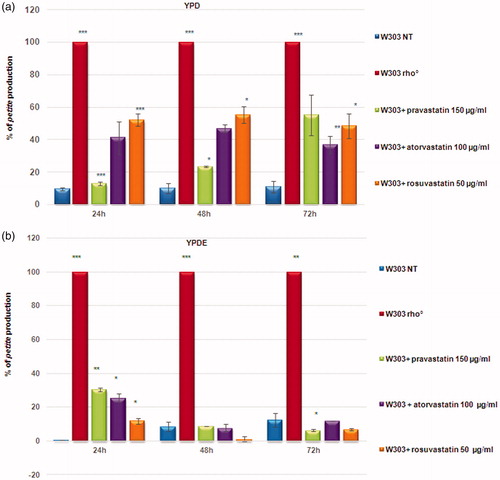
Figure 2. Statins treatments induced the loss of mitochondrial DNA and the ergosterol suppressed this phenotype. (a) DAPI staining of cells presented in Fig. 1; wild type W303, W303 rho° and wild type W303 treated with pravastatin 150 µg/ml, atorvastatin 100 µg/ml and rosuvastatin 50 µg/ml grown in YPD and YPDE media (YPD supplemented with 0,5mg/ml ergosterol). Bar: 2 µm. The magnification is the same in each picture. (b) The histogram shows the percentage of cells without mitochondrial DNA. An average of 300 cells were counted.
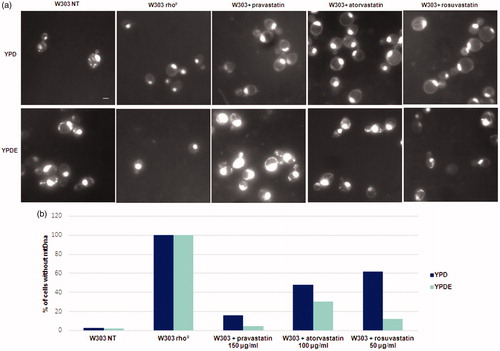
Figure 3. The oxygen consumption rate of yeast cells treated with statins is low compared to the wild type strain. (a) Oxygen consumption of W303, W303 rho° and W303 cells treated with statins in YPD medium showed low oxygen consumption in cells treated with statins; (b) The respiration rate is higher when the same cultures were grown in YPD medium supplemented with ergosterol. The oxygen consumption rate is expressed as O2 nmol/ml, and the respiration rates was normalized for cell number.
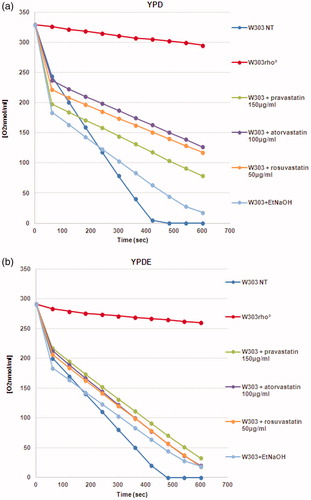
Figure 4. Statins treatments in S. cerevisiae results in an aberrant mitochondrial morphology phenotype, similar to that of rho° cells and this phenotype is suppressed by ergosterol. (a) W303 was treated with pravastatin 150 µg/ml, atorvastatin 100µg/ml and rosuvastatin 50 µg/ml grown in YPD and YPDE media in exponential growth phase; mitochondria were visualized with mitoGFP. (b) The histogram shows the percentage of cells with tubular mitochondria. As a control, W303 rho° strain was used. Bar: 2 µm. The magnification is the same in each picture.
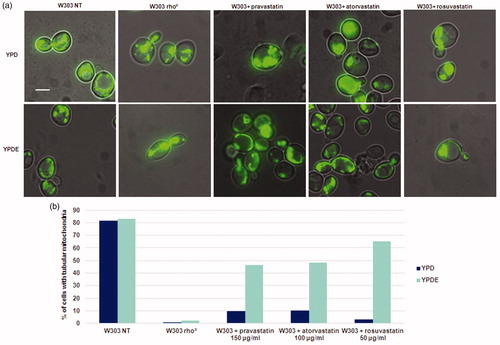
Figure 5. Statins treatments induced the re-localization of Erg27, a sensor of mitochondrial state, from lipid droplets to nuclear and cortical ER. The Erg27 localization in wild type cells is predominantly in lipid droplets, while in rho° cells the enzyme is mainly in nuclear and cortical endoplasmic reticulum. Wild type W303 with the ERG27-GFP fusion integrated in the genome was visualized at fluorescence microscopy after statins treatments, pravastatin 150µg/ml, atorvastatin 100µg/ml and rosuvastatin 50µg/ml in exponential growth phase in YPD medium. Bar: 2 µm. The magnification is the same in each picture.
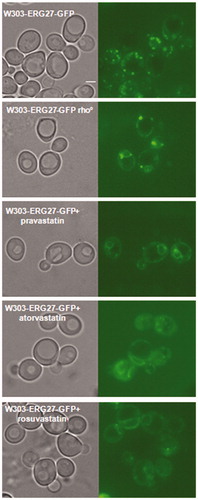
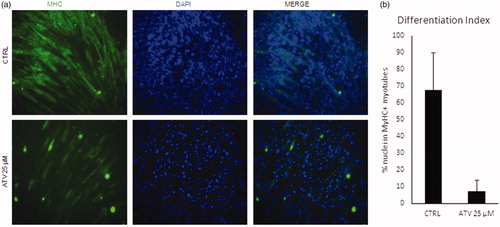
Figure 6. Statins block C2C12 differentiation and induce loss of mtDNA. (a) C2C12 were treated for 48 with 25uM atorvastatin (ATV) in growth medium and then induced to differentiate for further 48h either. Non-treated cells were used as a control (CTRL). Representative images of immunofluorescence for Myosin Heavy Chain (MyHC, green) are shown. Nuclei were counterstained with DAPI (blue). (b) Graph shows the quantification of the percentage of nuclei inside MyHC positive myotubes (Differentiation index). Data are presented as the average of n=3 replicates +/- SD. Significance has been assessed by t-test (*p < 0.05).