Figures & data
Figure 1. The basic skeleton structures of flavonoids and their scaffolds. Basic representative structures of the most common flavonoids classified in this study were drawn with rings and numbered positions.
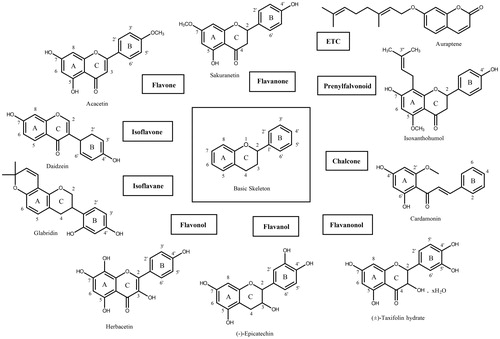
Figure 2. Results from the FRET method. Each data point represents the effect of each inhibitory compound against SARS-CoV 3CLpro compared to the control. The RFU are plotted against the log-concentration of inhibitory compounds. Each dot is expressed as the mean ± standard error of the mean (n = 3). RFU: Relative Fluorescence Units.
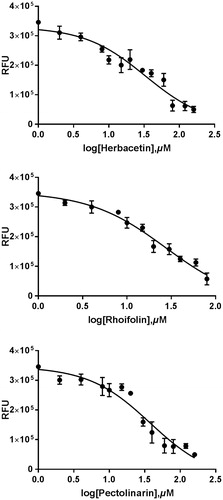
Figure 3. Fluorescence quenching spectra of SARS-CoV 3CLpro. A solution containing 1 μM SARS-CoV 3CLpro showed a strong fluorescence emission (the solid line) with a peak at 340 nm at the excitation wavelength of 290 nm. After adding 40 μM each inhibitory compound such as herbacetin (the dashed line), rhoifolin (one dashed one dotted line) and pectolinarin (one dotted line), fluorescence quenching spectra were obtained.
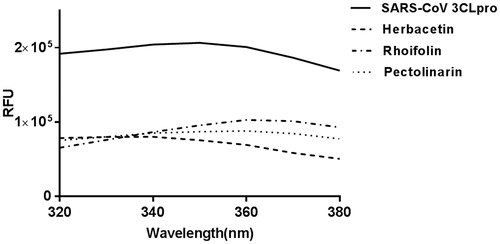
Figure 4. Predicted complexes of flavonoids in the catalytic site of SARS-CoV 3CLpro. Docking poses of (A) herbacetin, kaempferol and morin and (B) rhoifolin and pectolinarin were depicted on the electrostatic surface potential of SARS-CoV 3CLpro (red, negative; blue, positive; white, uncharged). Flavonoids were predicted to occupy the active site of SARS-CoV 3CLpro. The 2D schematic representations of the interactions of five flavonoids were also drawn. Figures were created with Maestro v11.5.011. S1 represents the polar S1 site of SARS-CoV 3CLpro, S2 for the hydrophobic S2 site, and the S3′ site with no strong tendency. The pink arrows represent hydrogen bond interaction.
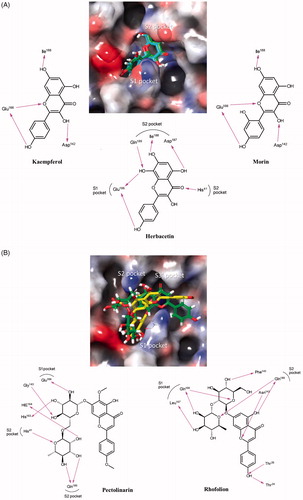
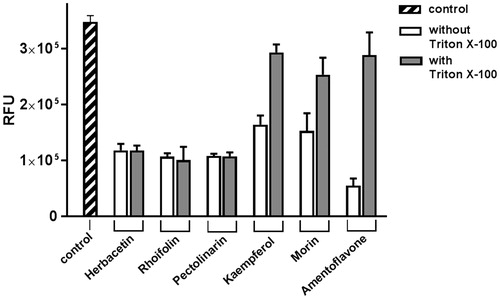
Figure 5. The effect of Triton X-100 on flavonoids. Each of two bars represents the inhibitory activity of compounds w/wt 0.01% Triton X-100. The first bar (shaded) represents the control. Inhibitory compounds were used at 40 μM concentration. Each bar is expressed as the mean ± standard error of the mean (n = 3). RFU: Relative Fluorescence Units.