Figures & data
Figure 1. (a) Structures of reported DGAT1 inhibitors; (b) diagram showing structural features of DGAT-1 inhibitors.
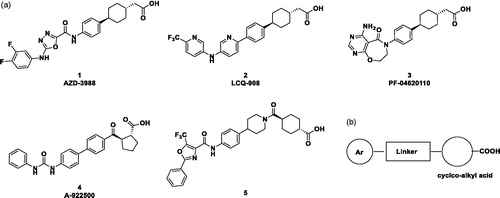
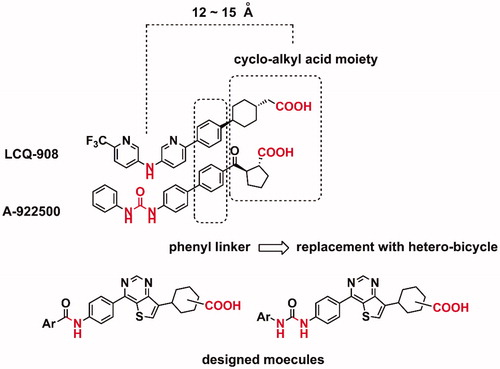
Figure 2. A schematic strategy for the design of target molecules.
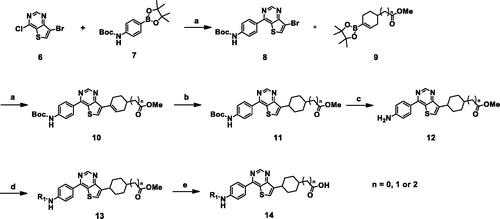
Scheme 1. Synthesis of thienopyrimidine derivatives. Reagents and conditions: (a) Pd(PPh3)4, 2 N Na2CO3, 1,4-Dioxane; (b) H2, 20% PdOH, EtOH/1,4-Dioxane; (c) TFA, DCM, rt; (d) aryl chloride, pyridine, DCM 0 °C to rt or aryl isocyanate, THF, 12 h, rt; (e) NaOH or LiOH, THF/MeOH/H2O (1:1:1), rt.
Scheme 2. Reagents and conditions: (a) THF, rt; (b) separation by using ethyl acetate at 60–70 °C; filtrate for 15a and solid for 15b; (c) NaOH, THF/MeOH/H2O; (d) 1 M NaOH, MeOH, rt.
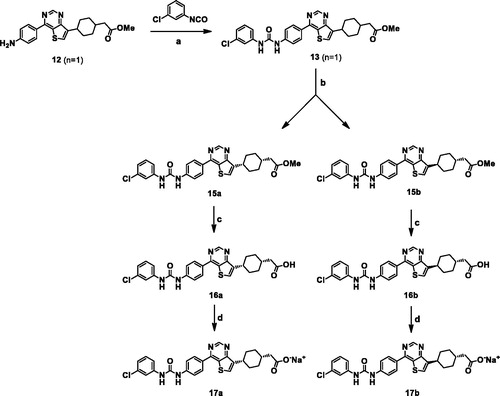
Table 1. DGAT-1 inhibitors and their in vitro data.
Table 2. Enzyme and cellular inhibitory potencies for selected compounds.
Table 3. Pharmacokinetic profiles of compounds 17a, 17b in ICR mice.Table Footnotea
Table 4. Oral pharmacokinetic profile of 17a in rat and dog.
Table 5. In vitro microsomal stability and cytochrome P450 (CYP) inhibition assay of compound 17a.
Figure 3. Effect of 17a in the oral lipid tolerance test (n = 5, ***p < .001). Serum TG (or TAG) concentration was measured before and 1, 2, and 4 h after oral administration of corn oil in ICR mice treated with 17a (3 mg/kg) or 2 (1 mg/kg). Vehicle for 2: 0.5% methylcellulose/0.5% Tween80 in distilled water, vehicle for 17a: 0.5% Tween80 in distilled water.
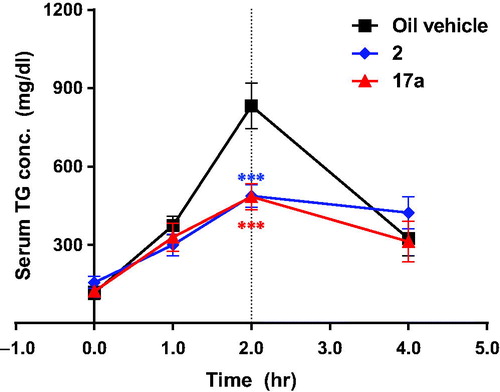
Figure 4. Effect of 17a in a canine oral lipid tolerance test (n = 2, *p < .05; ***p < .001). The dog was treated with 17a (po. 1 mg/kg) or 2 (po. 1 mg/kg) before oral administration of corn oil. Vehicle for 2: 0.5% methylcellulose/0.5% Tween80 in distilled water, vehicle for 17a: 0.5% Tween80 in distilled water.
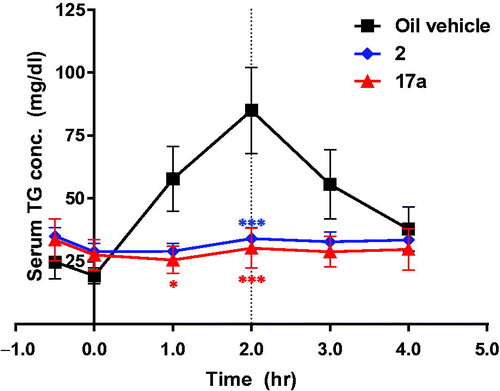
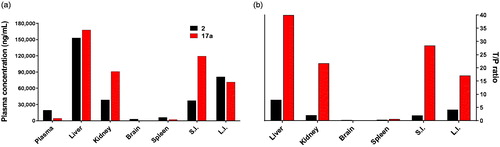
Figure 5. Tissue distribution of 17a in mice. 17a and 2 were orally administered to ICR mice at 30 mg/kg (n = 3). (a) AUC values of 17a and 2 in indicated tissues. Each bar shows AUC obtained from concentrations measured at 0.5 h, 1 h, 2 h, 4 h, and 24 h after dosing. Data represent mean value. (b) Tissue-to-plasma (T/P) ratio of 17a and 2. S.I.: small intestine, L.I.: large intestine.