Figures & data
Figure 1. Structures and potencies of 1, 2 and talmapimod analogue 6a.
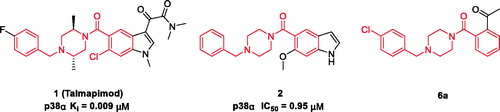
Figure 2. The design of talmapimod analogues.
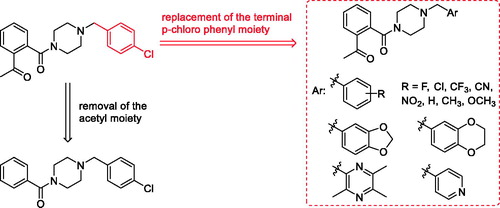
Figure 3. The generation of compound 6a, an unexpected product, from the reaction between 3 and 4.
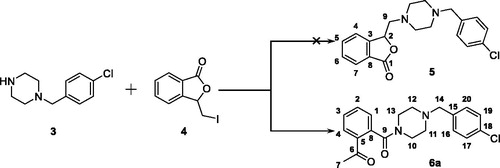
Figure 4. The possible mechanism for the generation of 6a.
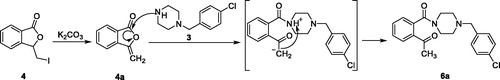
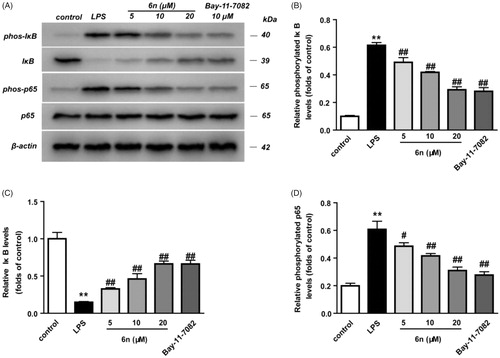
Figure 5. Compound 6n inhibited LPS-induced NF-κB activation in RAW264.7 cells. RAW264.7 cells were co-incubated with 6n (5, 10, 20 μM) and LPS (200 ng/mL) for 30 min. The levels of NF-κB p65, IκB, and their phosphorylated forms were analysed using western blot. The results were showed as means ± SD (n = 3); **p < 0.01 vs. compared with the control group; #p < 0.05, ##p < 0.01 vs. compare with LPS-stimulated group.
Scheme 1. Reagents and conditions: (a) I2, CH3CN, 25 °C; (b) K2CO3, CH3CN, 25 °C; (c) oxalyl chloride, 1–(4-chlorbenzyl)piperazine, DCM, Et3N, 25 °C.
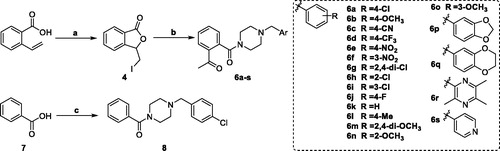
Table 1. Results of anti-inflammatory activity in vivo of compounds and DEX (Mean ± SD, n = 6).
Figure 6. Compound 6n inhibited LPS-induced iNOS and COX-2 expressions in RAW264.7 cells. The cells were pre-treated with different concentrations of 6n and then were stimulated with LPS (200 ng/mL) for 24 h. Bay 11–7082 is the NF-κB inhibitor. Cell viability was evaluated using the MTT assay. NO production was measured using nitrite and nitrate assay. iNOS and COX-2 expression were detected by Western blot. (A) Cell viability assay; (B) Quantitative analysis of NO productions; (C) Quantitative analysis of iNOS expressions, (D) Quantitative analysis of COX-2 expressions. β-actin was used as loading control. The results were showed as means ± SD (n = 3); **p < 0.01 vs compared with the control group; #p < 0.05, ##p < 0.01 vs compared with LPS-stimulated group.
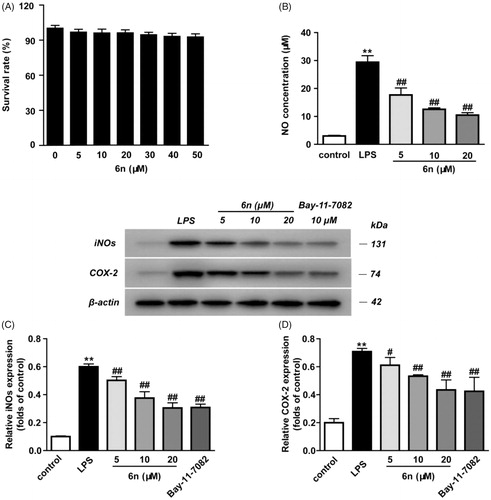
Figure 7. Compound 6n inhibited LPS-induced MAPK-signalling activation in RAW264.7 cells. RAW264.7 cells were co-incubated with 6n (5, 10, 20 μM) and LPS (200 ng/mL) for 30 min. The levels of p38, JNK, ERK1/2 and their phosphorylated forms were analysed using western blot. The results were showed as means ± SD (n = 3); **p < 0.01 vs compared with the control group; #p < 0.05, ##p < 0.01 vs compare with LPS-stimulated group.
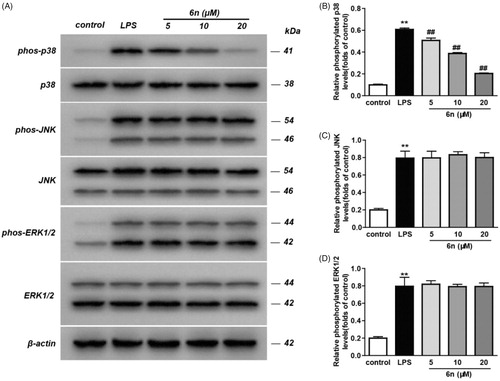
Table 2. P38α MAPK, COX-1 and COX-2 inhibition activity in vitro.
Table 3. Docking results of 6f, 6j, 6n and 8
Figure 8. (A) Overlay of docking poses of 6n (green sticks) and the co-crystallised ligand (orange sticks) in the binding site of p38α MAPK. (B) Docking and binding pattern of 6n (green sticks) into p38α MAPK active site. (C) Docking and binding pattern of 6n (green sticks) into COX-2 active site. (D) Docking and binding pattern of 6n (green sticks) into COX-1 active site. Dashed lines represent hydrogen bonds.
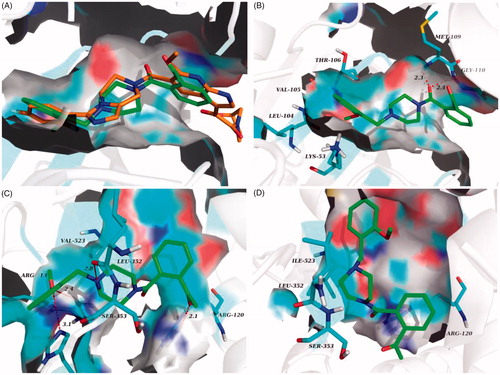
Figure 9. (A) Docking and binding pattern of 6j (green sticks) into COX-2 active site. (B) Docking and binding pattern of 6f (green sticks) into COX-2 active site. Dashed lines represent hydrogen bonds.
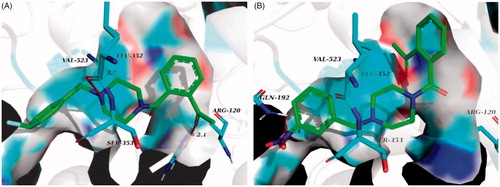
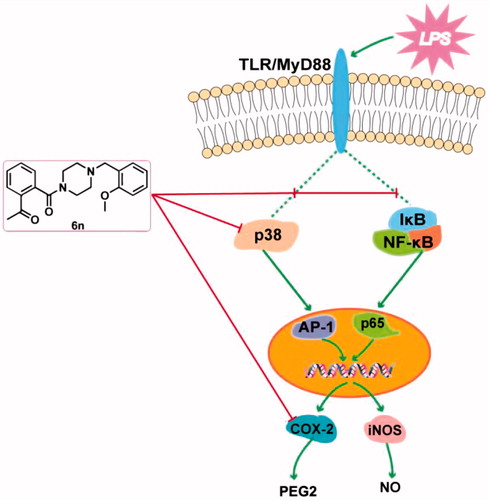
Figure 10. Anti-inflammatory molecular mechanism of 6n.