Figures & data
Figure 1. Fit of kinetic progress curve data for each sample. Symbols represent absorbance readings at the given reaction time. Only one progress curve per sample and only half of the data points per progress curve are shown, for clarity. Smooth lines represent least-square model curves generated by fit of the theoretical equation EquationEquation (2)(2)
(2) with the parameter values obtained by modified model (GraphPad, Lambert W) shown in .
![Figure 1. Fit of kinetic progress curve data for each sample. Symbols represent absorbance readings at the given reaction time. Only one progress curve per sample and only half of the data points per progress curve are shown, for clarity. Smooth lines represent least-square model curves generated by fit of the theoretical equation EquationEquation (2)(2) [P]t=[S]0−Km⋅(1.45869⋅ ln (1.2⋅x ln (2.4⋅x ln (1+2.4⋅x)))−0.45869⋅ ln (2⋅x ln (1+2⋅x)))(2) with the parameter values obtained by modified model (GraphPad, Lambert W) shown in Table 1.](/cms/asset/e5143cd3-6320-4e9c-be95-d2218282e039/ienz_a_1695792_f0001_b.jpg)
Table 1. Parameters aquired by progress–curve fitting. Comparison of fitted values obtained using the numerical integration approach (DynaFit, see Ref. [Citation9]), the exact algebraic model EquationEquation (1)(1)
(1) with the Lambert W(x) function (DynaFit, see Ref. [Citation9]), and the approximation of W(x) of the modified model EquationEquation (2)
(2)
(2) (GraphPad, Lambert W, see Ref. [Citation11]). The measurements for each sample were carried in duplicate or triplicate. Data are means ± SD.
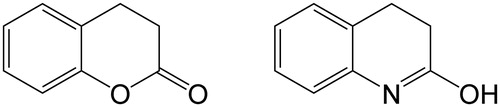
Figure 2. Paraoxonase-1 lactone substrate dihydrocoumarine (left) and its competitive inhibitor 2-hydroxyquinoline (right).