Figures & data
Figure 1. Nanoparticle tracking analysis (NTA) quantification of exosomes released from plasma of PCa patients and CTR. (A) NTA distribution of CTR exosomes. (B) NTA distribution of PCa exosomes. (C) Concentration (particles/ml) of exosomes. Mean ± SE of plasma exosomes from 8 CTR and 8 PCa patients are shown. The p values was <.1 in PCa plasma respect to CTR plasma exosomes. *p < .1.
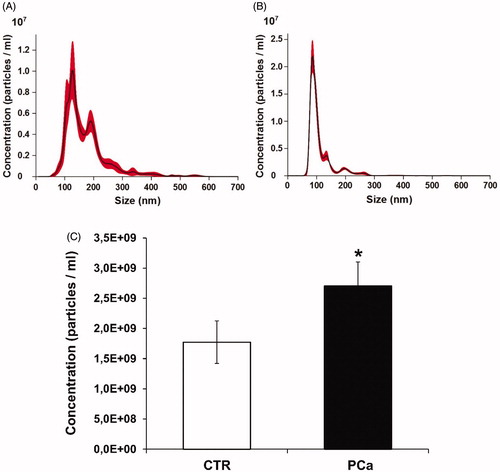
Figure 2. Western blot analysis of plasmatic exosomes from PCa patients and CTR after 30% sucrose density gradient ultracentrifugation for housekeeping markers (Alix and CD81) and CA IX expression. (A) Protein characterisation of exosomal fractions purified from plasma of PCa patients performed with anti-Alix, anti-CD81 and M75 (CA IX). (B) Protein characterisation of exosomal fractions purified from plasma of CTR performed with anti-Alix, anti-CD81 and M75 (CA IX).
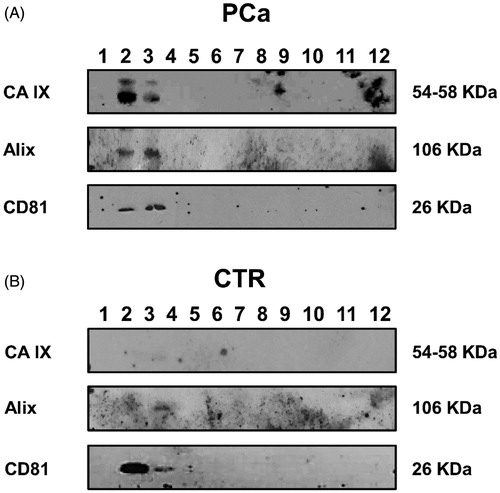
Figure 3. Detection, quantification and characterisation of CAIX+/CD81+ exosomes purified from PCa and CTR plasma by ELISA test. ELISA analysis of CAIX and CD81 expression in exosomes purified from plasma of 8 PCa patients and 8 CTR (1 ml for each sample). Rabbit polyclonal anti-CD81 antibody was used for the capture of exosomes on the plate. Expression levels of exosomal CAIX were expressed as means ± ES. The p values was <.0001 in PCa plasma exosomes respect to CTR plasma exosomes. ****p < .0001.
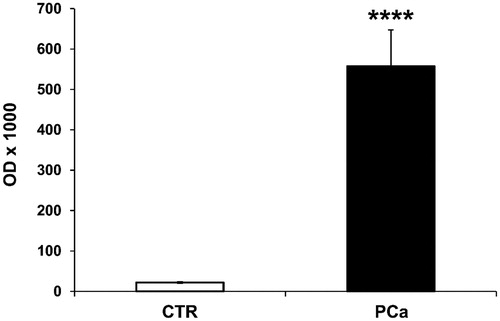
Figure 4. Analysis of CAIX enzymatic activity of plasma exosomes from PCa and CTR. CA IX activity is shown for plasma exosomes purified from 8 PCa patients and 8 CTR. The results were expressed as means ± SD of CA-activity/mg protein found in exosomes. The p values was <.0001 in PCa plasma exosomes respect to CTR plasma exosomes. ****p < .0001.
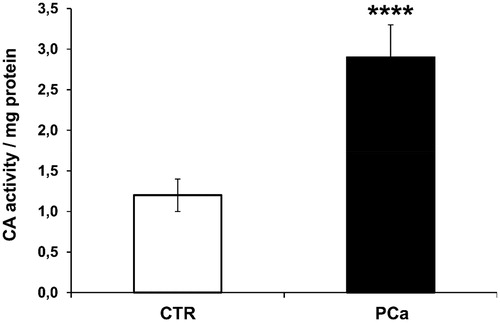
Figure 5. Nanoscale flow cytometry of plasma exosomes in PCa and CTR for intraluminal pH evaluation. The cytometer was calibrated using a mixture of non-fluorescent silica beads and fluorescent (green) latex beads with sizes from 110 nm to 1300 nm. The exosome preparation derived from plasma of 8 PCa patients and 8 CTR were stained 20 min at RT with anti-CD81 antibody and BCECF AM (10 µM) and analysed using flow cytometry. The double-positive events were then analysed for their size, based on the calibration with beads. Cumulative data are shown of the absolute number of CD81+/BCECF + exosomes of size less than 180 nm recovered from the plasma samples. Data are expressed as means ± SE. The p values was <.1 in PCa plasma exosomes compared to CTR. *p < .1.
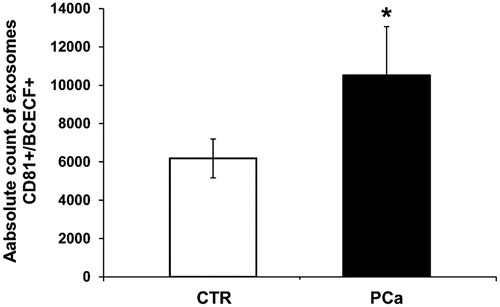
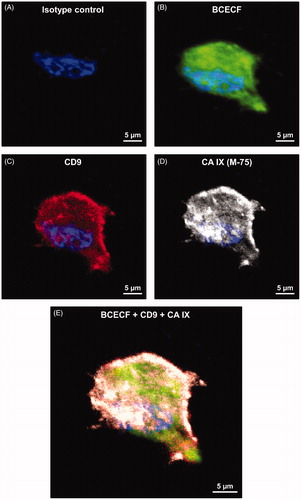
Figure 6. Confocal microscopy analysis of BCECF and CA IX expression in LNCaP cell line cultured at pH 6.5. (A) Isotype control cell. (B) LNCaP cell labelled with BCECF (green signal). (C) LNCaP cell labelled with CD9 monoclonal antibody (M-L13, RUO, red signal). (D) LNCaP cell incubated with M75 and then with Alexa Fluor® 647 secondary antibody for CA IX detection (gray signal). (E) Merged image of different signals on LNCaP cells: BCECF (green signal), CD9 (red signal), CA IX (grey signal), nucleus (blue signal of DAPI).