Figures & data
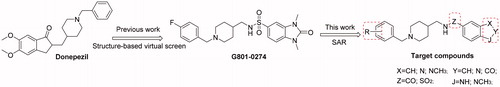
Figure 1. Design of a series of 1,3-dimethylbenzimidazolinone derivatives as cholinesterase inhibitors.
Scheme 1. Reagents and conditions: (a) K2CO3, CH3OH, 85 °C, 5 h; (b) LiAlH4, THF, reflux, 5 h; (c) di(1H-imidazol-1-yl)methanone, CHCl3, 60 °C, 12 h; (d) NaH, MeI, DMF, r.t.; (e) THF, H2O, LiOH, 50 °C 2 h; (f) PyBOP, DIPEA, DMF, r.t, 4 h; (g) Chlorosulfonic acid, rt, 6 h; and (h) Et3N, CH2Cl2, r.t, 4 h.
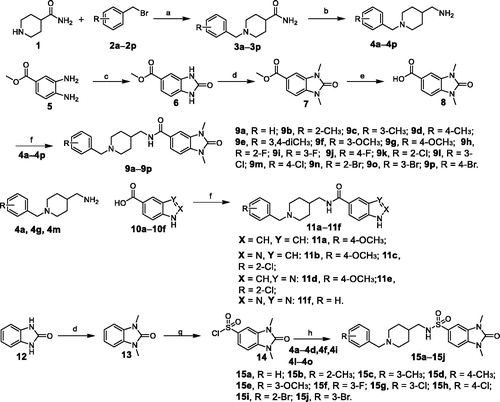
Table 1. Structures, eeAChE and eqBChE inhibitory activities of target compounds.
Figure 2. (A) Lineweaver–Burk plot for the inhibition of eeAChE by compound 15b at different concentrations of substrate. (B) Lineweaver–Burk plot for the inhibition of eqBChE by compound 15j at different concentrations of substrate.
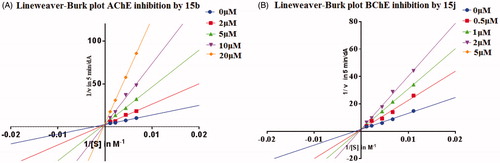
Figure 3. (A) Binding mode prediction of 15b with huAChE (PDB id: 4EY7). (B) Binding mode prediction of 15j with huBChE (PDB id: 4TPK). Colour coding: green, hydrogen bond; red, π–π stacking; orange, π–sulphur; purple, π–alkyl.
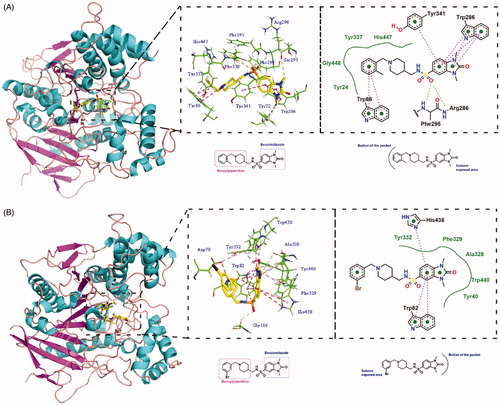
Figure 4. (A) In vitro cell toxicity of 15b and 15j on PC-12 cell line. (B) In vitro hepatotoxicity of 15b and 15j on HepG2 cell line. Data were expressed as mean ± SD (n = 3).
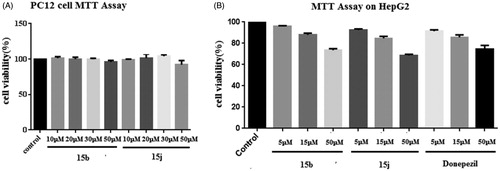
Figure 5. Effects of oral administration of tacrine (15 mg kg−1), 15b (15 mg kg−1), and 15j (15 mg kg−1) on scopolamine-induced cognitive impairment in ICR mice determined by the Morris water maze test. (A) The latency to target; (B) the distance to target; and (C) the trajectories of mice. Data are presented as the mean ± SEM (n = 6; ***p < 0.001 vs. scopolamine group).
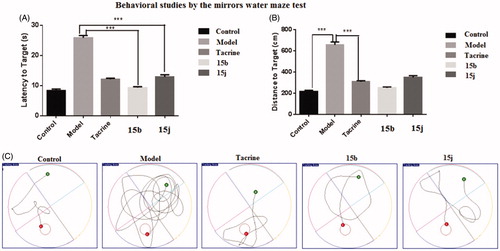
Table 2. Effects of oral administration of 15b and 15j (15 mg kg−1) on scopolamine-induced memory impairment in ICR mice evaluated by the Morris water maze test. Tacrine (15 mg kg−1) was used as positive control. Data are presented as the mean ± SEM (n = 6).
Figure 6. The ALT and AST levels. (A) The ALT levels of five subgroups. (B) The AST levels of five subgroups. Data are presented as the mean ± SEM (n = 6; ns p > 0.05).
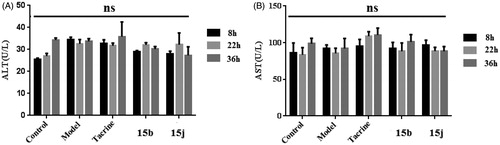
Table 3. ALT and AST activity after the administration of 15b and 15j. Tacrine (30 mg kg−1) was used as the reference compound. Values are expressed as the mean ± SEM of six independent experiments.
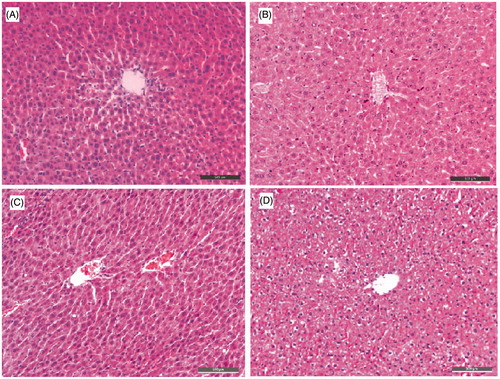
Figure 7. Histopathological study of livers of male mice after treatment with the solvent only (control, A), or 36 h after administration of tacrine (B), 15b (C), or 15j (D). HE staining, original magnification ×200.