Figures & data
Figure 1. Reported pyrimidine-based anticancer molecules and design rationale for anticancer 2,5-diamino-4-pyrimidinol derivatives.
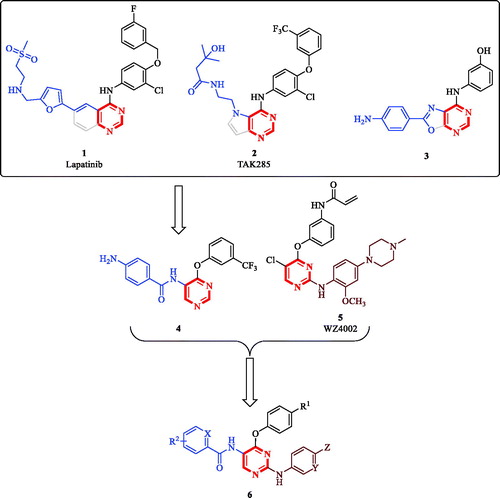
Table 1. General structure and specific examples of the compounds being evaluated for their antiproliferative effects in this report.
Table 2. GI50 values (μM) exhibited by selected compounds over M-NFS-60 murine myeloblastic leukaemia cell line.
Table 3. % Inhibition of kinase reactions of a panel of kinases by 10 μM doses of compound 6e.
Figure 2. Measured % growth inhibition of various hematological cancers triggered by 10 µM doses of compounds 6a–h and hit compound 4. Values are the averages of duplicate assays.
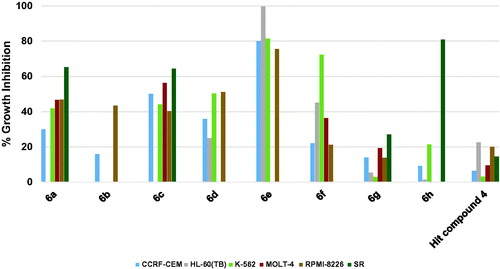
Figure 3. Measured % growth inhibition of various NSCLC cells triggered by 10 µM doses of compounds 6a–h and hit compound 4. Values are the averages of duplicate assays.
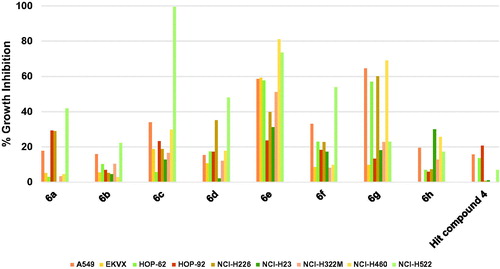
Figure 4. Measured % growth inhibition of various colon cancers triggered by 10 µM doses of compounds 6a–h and hit compound 4. Values are the averages of duplicate assays.
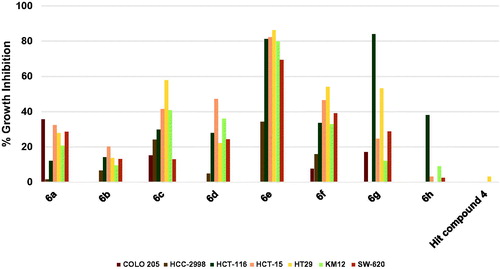
Figure 5. Measured % growth inhibition of various brain cancer cell lines triggered by 10 µM doses of compounds 6a–h and hit compound 4. Values are the averages of duplicate assays.
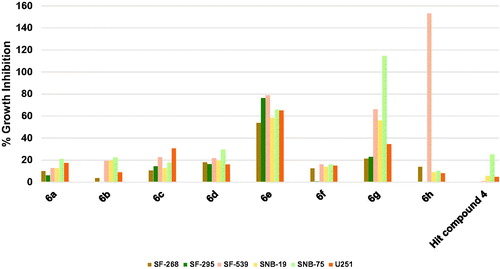
Figure 6. Measured % growth inhibition of various melanoma cell lines triggered by 10 µM doses of compounds 6a–h and hit compound 4. Values are the averages of duplicate assays.
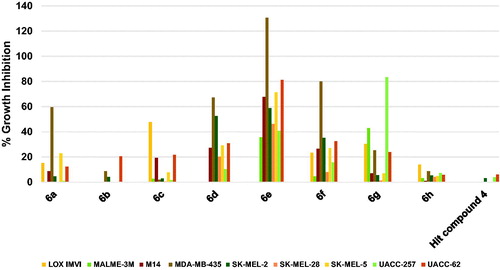
Figure 7. Measured % growth inhibition of various ovarian cancer cell lines triggered by 10 µM doses of compounds 6a–h and hit compound 4. Values are the averages of duplicate assays.
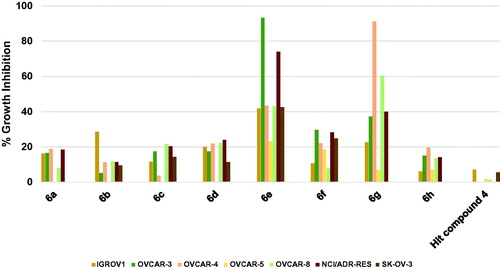
Figure 8. Measured % growth inhibition of various renal cancer cells triggered by 10 µM doses of compounds 6a–h and hit compound 4. Values are the averages of duplicate assays.
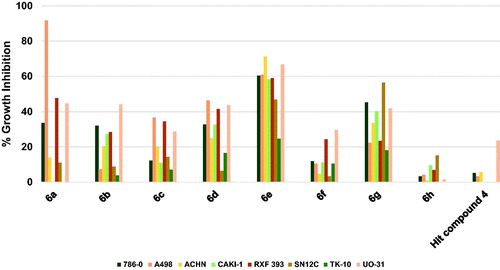
Figure 9. Measured % growth inhibition of various prostate cancer cell lines triggered by 10 µM doses of compounds 6a–h and hit compound 4. Values are the averages of duplicate assays.
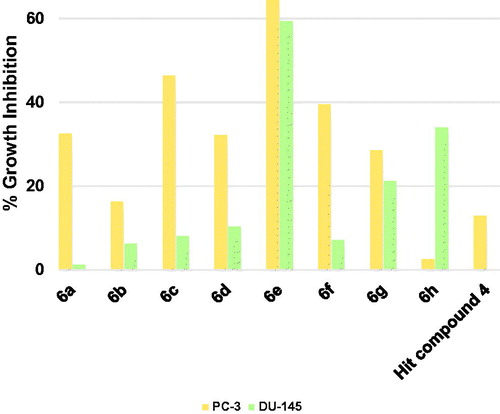
Figure 10. Measured % growth inhibition of various breast cancer cells triggered by 10 µM doses of compounds 6a–h and hit compound 4. Values are the averages of duplicate assays.
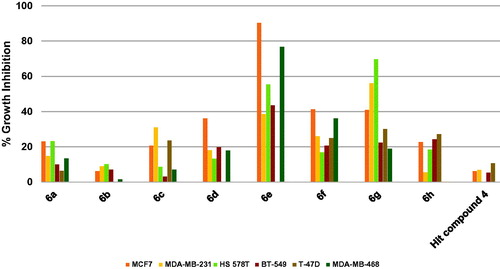
Figure 11. Average % values of measured growth inhibition of nine cancer diseases triggered by 10 µM doses of compounds 6a–h and hit compound 4. Values are the averages of duplicate assays.
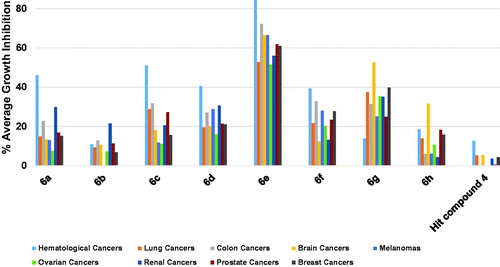
Table 4. In vitro measured effective permeability (Pe) of compound 6e as well as verapamil and ranitidine using PAMPA-GIT.
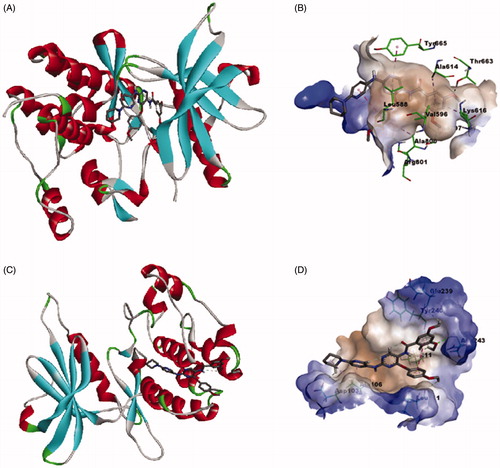
Figure 12. Calculated binding modes and interactions of compound 6e: (A) Compound 6e docked within kinase binding site of CSF1R (PDB code: 3KRJ); (B) Predicted interactions of compound 6e within the binding pocket of CSF1R (PDB code: 3KRJ); (C) Compound 6e docked within substrate-binding site of DAPK1 (PDB code: 4TXC); (D) Predicted interactions of compound 6e within the substrate binding pocket of DAPK1 (PDB code: 4TXC).
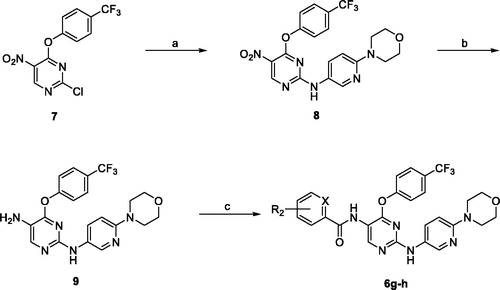
Scheme 1. Synthesis of compounds 6g–h. Reagents and conditions: (a) 6-morpholinopyridin-3-amine, pyridine, THF, rt, 12 h; (b) H2, 10% Pd/C, MeOH, rt, 12 h; (c) appropriate acyl chloride, DIPEA, DCM, −78 °C to rt, 2 h.