Figures & data
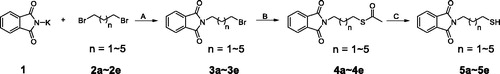
Scheme 1. Synthesis of intermediates 5a–5ea. aReagents and conditions: (A) Acetone, 70 °C, overnight-; (B) Potassium thioacetate (3.0 eq), THF, 75 °C, 5 h; (C) concentrated HCl, MeOH, 60 °C, 4 h.
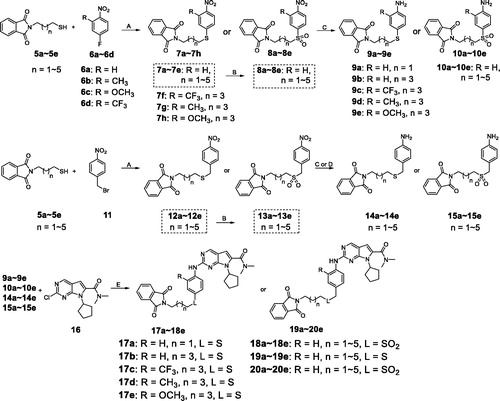
Scheme 2. Synthesis of intermediates 17a–18e, 19a–20ea. aReagents and conditions: (A) K2CO3 (2.0 eq), DMF, rt, 4.5 h; (B) m-CPBA (4.5 eq), DCM, 0 °C to rt, 2 h; (C) Fe/AcOH, MeOH, 60 °C, 5 h; (D) Zn, MeOH, rt, 1.5 h; (E) Pd(OAc)2 (0.10 eq), BINAP (0.06 eq), Cs2CO3 (2.0 eq), 1,4-dioxane, 105 °C, 7 h.
Scheme 3. Synthesis of derivatives X1–X23a. aReagents and conditions: (A) Hydrazine hydrate (6.0 eq), MeOH, rt, 3 h; (B) CS2 (20.0 eq), dicyclohexylcarbodiimide (DCC, 1.1 eq), THF, rt, overnight; (C) m-CPBA (1.5 eq) , DCM, −10 °C to 0 °C, 2 h; (D) m-CPBA (4.5 eq), DCM, 0 °C to rt, 2 h.
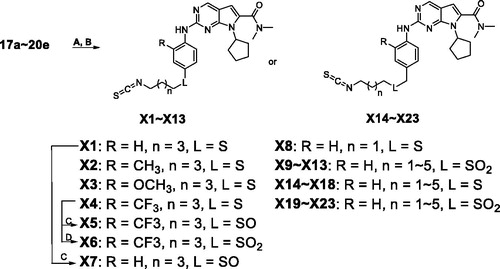
Table 1. Structure and enzymatic inhibition activity evaluation of compounds X1–X23.Table Footnotea
Table 2. Enzymatic inhibition activity evaluation of selected compounds.Table Footnotea
Table 3. In vitro cell growth inhibition (IC50) of selected compounds against multiple cancer cell lines.a
Figure 1. Representation of the predicted binding modes of compound X22 with CDKs kinase domain. X22 is shown in green. Hydrogen bonds are shown in red. (A) Proposed binding mode of compound X22 with CDK6 (PDB code: 4EZ5), CDK6 backbone is shown in light pink. (B) Proposed binding mode of compound X22 with CDK4, which employed CDK6 (PDB entry: 4EZ5) as the template for homology modelling, CDK4 backbone is shown in yellow. (C) Proposed binding mode of compound X22 with CDK9 (PDB code: 4BCF), CDK9 backbone is shown in light blue.
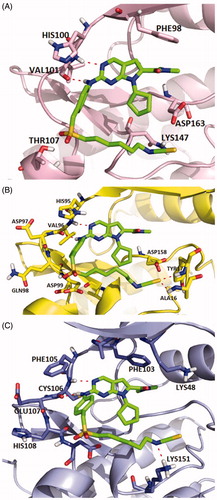
Figure 2. (A) Representation of the predicted binding mode of compound X22 with CDK9 kinase domain (PDB code: 4BCF). CDK9 backbone is shown in grey. X22 is shown in green. Hydrogen bonds are shown in red. (B) Representation of the hydrophobic pocket difference at the front of the ATP-binding site by overlaying CDK6 and CDK9. CDK6 is shown in grey. CDK9 is shown in orange.
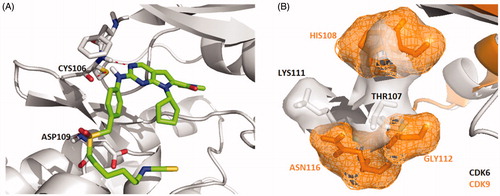
Figure 3. X22 induced G2/M phase arrest in breast and lung cancer cells. Cells were harvested after treatment with different concentrations of X22 or ribociclib for 24 h. Cells were fixed by 70% ethanol and stained with propidium iodide. Data are represented as histogram on the left and the percentage of cell cycle distribution are shown on the right. The assays were performed in triplicate.
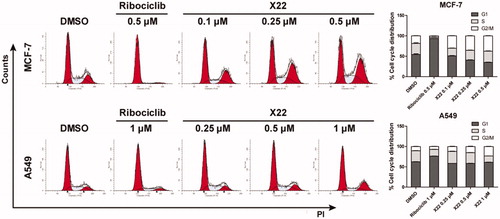
Figure 4. X22 suppressed the downstream signalling proteins of CDK4/9 in breast and lung cancer cells. Cells were incubated with the indicated concentrations of X22 or ribociclib for 24 h. Proteins were extracted and analysed by western blotting.
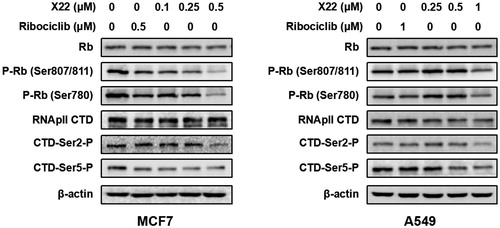
Figure 5. X22 induced cell apoptosis in breast and lung cancer cells. (A) Cells were seeded in six-well plates and treated with the indicated concentrations of X22 or ribociclib for 48 h. Cells were then stained with the AnnexinV-FITC Apoptosis Detection Kit, followed by flow cytometry analysis. Quantitative data are expressed as mean ± SD of the percentages of apoptotic cells from three independent experiments. (B) Expressions of p53, phospho-p53 (Ser15), Bax, Bcl-2 in MCF-7 and A549 cells were detected by western blotting after the treatment with the indicated concentrations of ribociclib or X22 for 48 h. *p < 0.05 versus DMSO; **p < 0.01 versus DMSO; ***p < 0.001 versus DMSO.
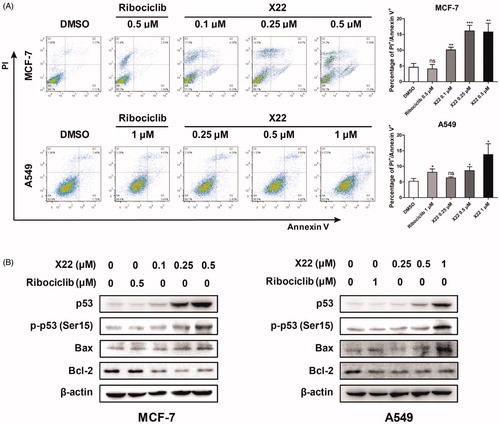
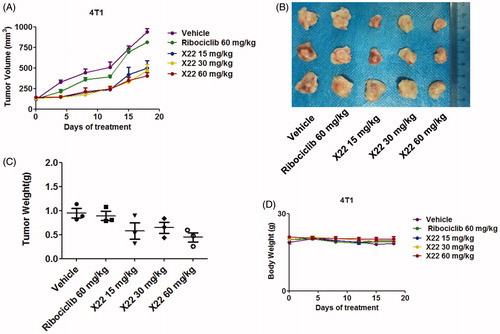
Figure 6. X22 significantly inhibited growth of breast cancer in homograft mouse models. (A) Tumour growth curve of 4T1 tumour-bearing mice in response to different treatments. (B) Photographs of 4T1 homograft tumours. Mice were sacrificed 18 days after tumour implantation. (C) The average tumour weight of excised tumours at day 18. (D) Body weight curves of BALB/c mice in each group after injection.