Figures & data
Table 1. Bioactivities for the different hCA isoforms relative to the final database ligands.
Figure 1. Graphical correlation between the Ti and SR of the possible dataset ligand pairs, using FP2 fingerprints (A) and MACCS fingerprints (B).
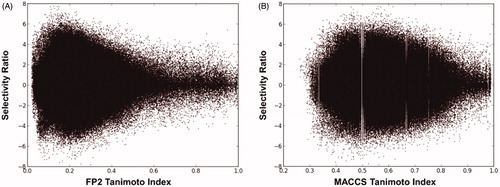
Figure 2. Classification analysis of the different clusters of dataset ligands generated using FP2 (A) and MACCS (B) fingerprints.
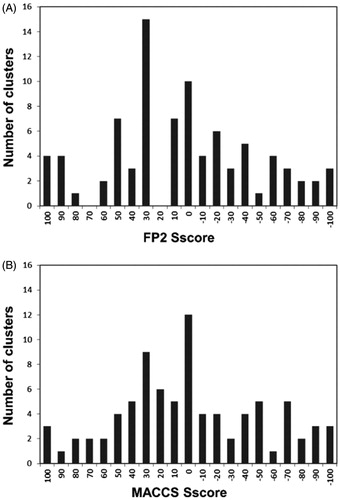
Figure 3. Representative clusters of selective hCA IX and unselective hCA IX/II ligands. The common scaffolds identified in these clusters are shown, together with a reference compound.
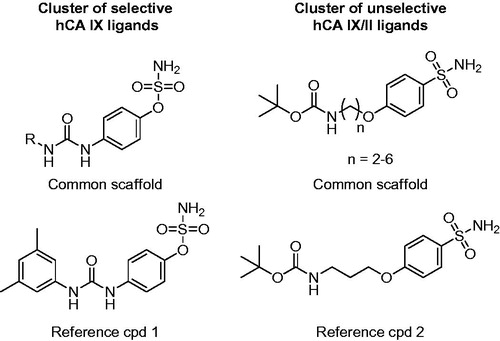
Figure 4. Representative clusters of selective hCA XII and double-selective hCA IX-XII ligands. The common scaffolds identified in these clusters are shown, together with a reference compound.
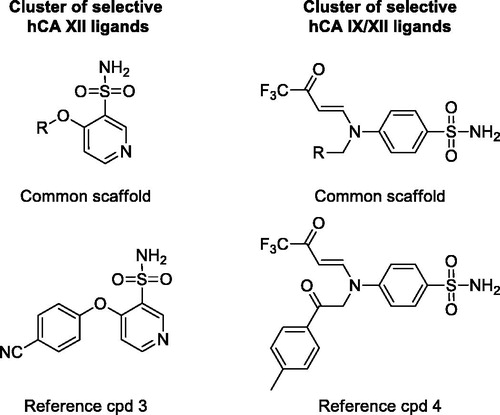
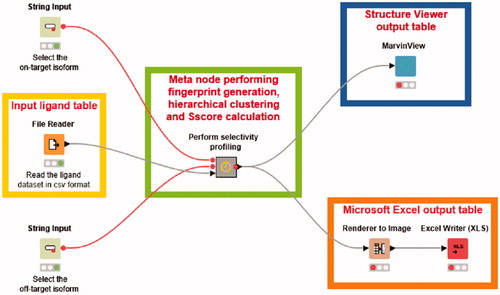
Figure 5. KNIME workflow for automatic selectivity profile analyses.