
Figures & data
Figure 1. Chemical structure of 8 g.
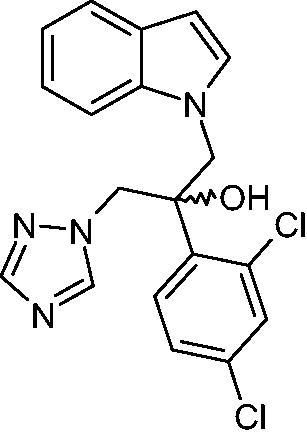
Table 1. Antifungal susceptibilities of Candida spp. to 8 g.
Figure 2. Survival curve of mice after treatment with fluconazole (3 x 5 mg/kg per os, □) or 8 g (2 x 30 mg/kg ip, Δ; 3 x 20 mg/kg ip, ▲). Control group (●). **p < 0.01; ***p <0 .001.
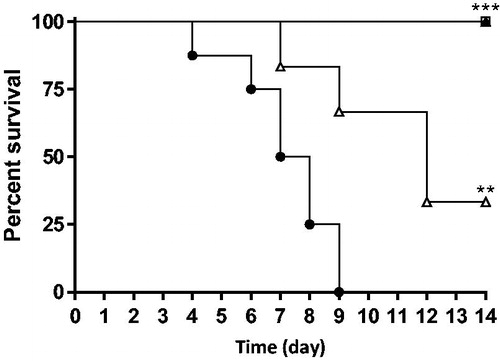
Table 2. Hydrolysis inhibition of the 1-octadecanoyl 2–(1-14 C) eicosatetraenoyl glycerol-3-phosphocholine after treatment with bromophenacyl bromide (BpB) and 8 g.
Table 3. Sterol profile of C. albicans (CAAL93), C. krusei (CAKR7) and C. glabrata (CAGL2) untreated and treated with fluconazole (FLU: 4 µg/mL) or 8 g (4 ng/mL or 4 µg/mL). –: not detected.