Figures & data
Figure 1. SAHA- SLC-0111 efficacy on A375M6, HCT116 and MCF7. (A) Cell viability after 72 h treatment of SLC-0111 alone or in combination with three doses of SAHA evaluated by MTT assay; ■ p ≤ .05 refers to the co-treatment SLC-0111 + SAHA respect to SAHA alone; ● p ≤ .05 refers to the co-treatment SLC-0111 + SAHA respect to SAHA and SLC-0111 alone. (B) Cell cycle distribution analysed by FACS; p ≤ .05 refers to the co-treatment SLC-0111 + SAHA respect to SLC-0111 alone.
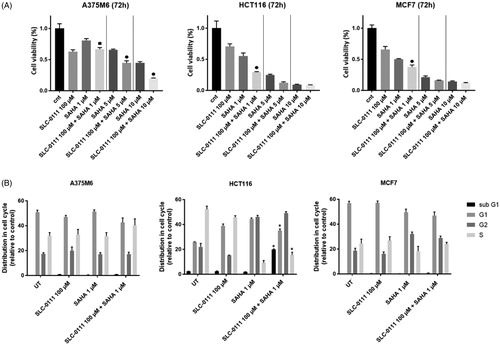
Figure 2. SAHA- SLC-0111 efficacy on the ability of A375M6, HCT116 and MCF7 to form colonies. (A) Colony Forming Units (CFU) assay of cells treated with SLC-0111 and/or SAHA; ● p ≤ .05 refers to the co-treatment SLC-0111 + SAHA respect to SAHA and SLC-0111 alone.
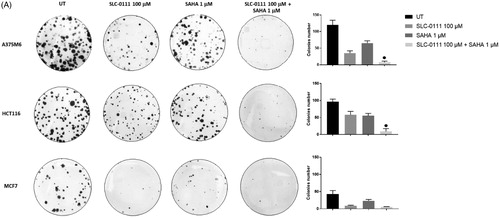
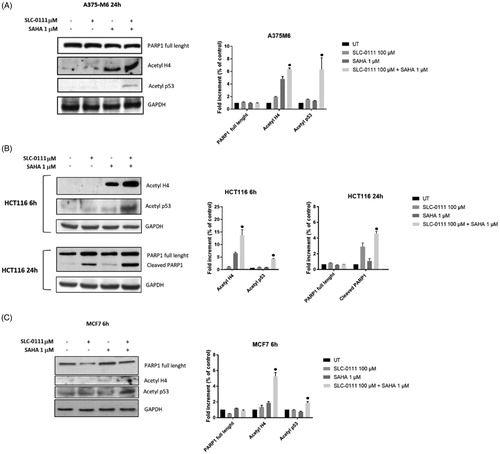
Figure 3. Molecular effect after the treatment with SLC-0111 and/or SAHA. (A) (Left) Representative Western blot of PARP1, Acetyl H4, Acetyl p53 after the treatment of A375M6 with SLC-0111 and/or SAHA. (Right) Densitometric quantification of PARP1, Acetyl H4, Acetyl p53 relative to GAPDH expression, expressed as a fold increment (%) compared to UT. ● p ≤ .05 refers to the co-treatment SLC-0111 + SAHA respect to SAHA and SLC-0111 alone. (B) (Left) Representative Western blot of Acetyl H4 and Acetyl p53 after the treatment of HCT116 with SLC-0111 and/or SAHA for 24 h and representative Western blot of PARP1 and cleaved PARP1 after the treatment of HCT116 with SLC-0111 and/or SAHA for 24 h. (Right) Densitometric quantification of Acetyl H4, Acetyl p53, PARP1 and cleaved PARP1 relative to GAPDH expression, expressed as a fold increment (%) compared to UT. ● p ≤ .05 refers to the co-treatment SLC-0111 + SAHA respect to SAHA and SLC-0111 alone. (C) (Left) Representative Western blot of PARP, Acetyl H4 and Acetyl p53 after the treatment of MCF7 with SLC-0111 and/or SAHA for 6h. (Right) Densitometric quantification of PARP1, Acetyl H4 and Acetyl p53 relative to GAPDH expression, expressed as a fold increment (%) compared to UT. ● p ≤ .05 refers to the co-treatment SLC-0111 + SAHA respect to SAHA and SLC-0111 alone.