
Figures & data
Scheme 1. Synthesis of arylacetothioureas.
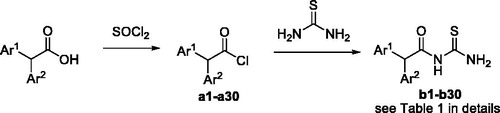
Table 1. Structure, inhibitory activity (IC50), antibacterial activity (MIC50) against H. pylori urease of compounds b1–b29.
Figure 1. Sensograms of interactions between b19 and urease.
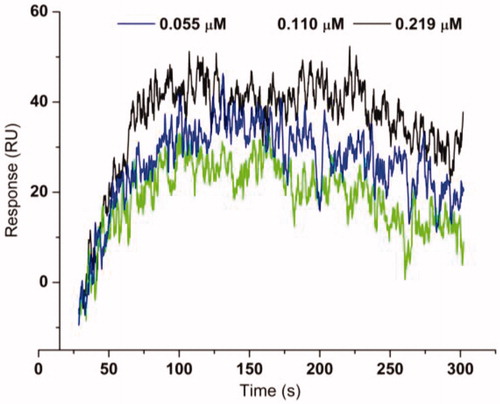
Table 2. The binding affinity data for urease–thioureas interactions.
Figure 2. Characterisation of urease inhibition by compound b19 for different preincubation time.
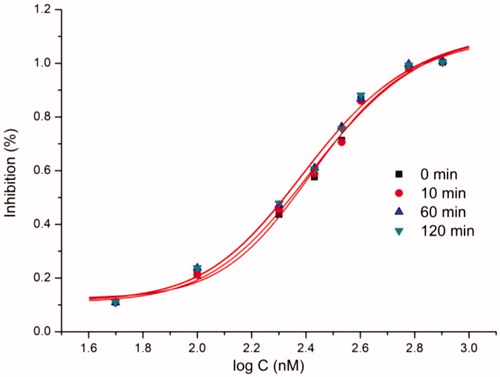
Figure 3. A velocity (V) was nonlinearly fitted against the concentrations of urea [S] in the presence of a specific concentration of compound b19. (B) (1) the fitted constants (
) from the corresponding V–S plot were plotted against concentrations of b19 ([I]); (2)
the fitted constants (
) from the corresponding V–S plot were plotted against concentrations of b19.
![Figure 3. A velocity (V) was nonlinearly fitted against the concentrations of urea [S] in the presence of a specific concentration of compound b19. (B) (1) Ki: the fitted constants (KmVmax(1+[I]Ki)) from the corresponding V–S plot were plotted against concentrations of b19 ([I]); (2) Ki': the fitted constants (1Vmax(1+[I]Ki′)) from the corresponding V–S plot were plotted against concentrations of b19.](/cms/asset/cbdcdec4-28e7-4e50-bece-e902474d1941/ienz_a_1706503_f0003_c.jpg)
Table 3. Data of inhibition mechanism.
Figure 4. Predicted binding mode of ligand-urease (PDB code: 1e9y): (A) compound b19 shown as white sticks and the enzyme shown as surface. (B) Compound b19 shown as cyan sticks and enzyme shown as lines; Hydrogen bonds shown as red dashed lines.
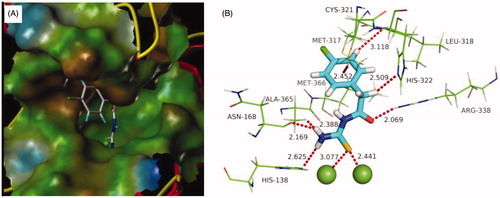
Figure 5. The RMSD values obtained during 6 ns of molecular dynamic simulation for urease and b19.
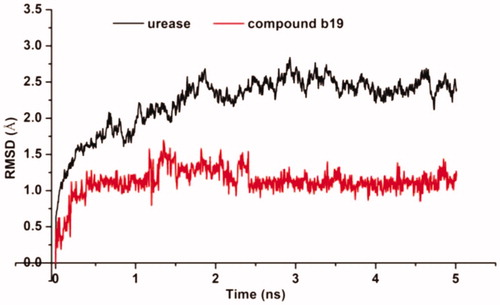
Table 4. Cell Viability of selected compounds on L-02 and P69 at concentration of 25 μg/mL.