Figures & data
Figure 1. Reaction scheme for the inhibition of BSCh hydrolysis by purified huBChE in the presence of DTNB by compounds 2C, 3A, and 3B. E, free enzyme; EA, acylated intermediate; S, substrate BSCh; P, all of the stoichiometrically released products (SCh-TNB, TNB–); and I, compounds (inhibitors) 2C, 3A, and 3B. The symbols for the constants are: kcat (k1), catalytic constant for BSCh turnover; Km (k0), Michaelis constant; Kp = k3/k2, inhibition constant for binding of the product thiocholine-TNB; K1 = k5/k4 and K2 = k7/k6, dissociation constants for binding of the compounds to the free and acylated enzyme, respectively.
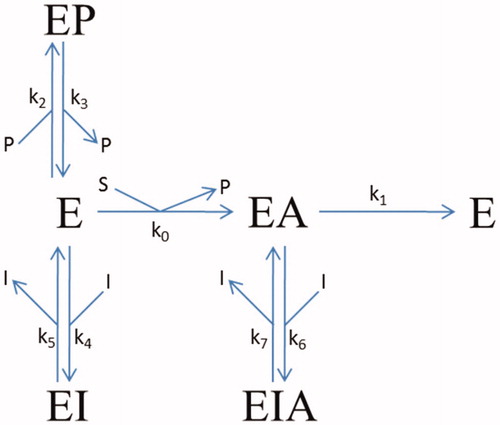
Figure 2. Structures of the parent non-fluorescent BChE inhibitors (compounds 1, 2, 3) and the synthesised fluorescent probes (1A, 2A–C, 3A–D). The IC50 values and residual activities (RAs) for inhibition of mAChE, huAChE, and huBChE are given.
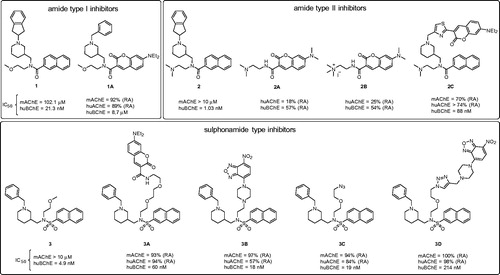
Figure 3. Time courses of product formation in the reactions between BSCh (54 μM) and purified huBChE (A, 0.47 nM; B, 0.49 nM; C, 0.43 nM) in the absence (red curves) and presence of 2C (5, 20, 50, 200 nM) (A), 3A (50, 100, 200, 500 nM, 1 μM) (B), and 3B (5, 10, 25, 33, 50 nM) (C).
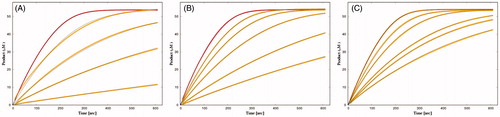
Table 1. Characteristic dissociation and rate constants for inhibition of huBChE by the fluorescent probes according to reaction scheme in .
Figure 4. Crystal structures of 2C (A), 3A (B), and 3B (C) (purple stick models) bound to huBChE (green ribbon model; PDB codes 6R6V, 6RUA, 6R6W, respectively). Key residues in the active site are shown as green sticks. (B, C) The polar H-bond between Thr120 and the sulphonamide moiety of compounds 3A and 3B, respectively, is shown as yellow dashes (distance: B, 3.4 Å; C, 3.2 Å).
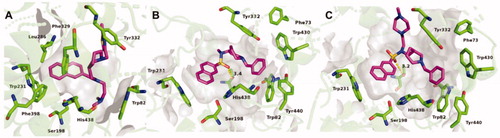
Figure 5. Alignments of crystal structures, with key residues in the active site, shown as green sticks. (A) Compound 2C (purple stick model; PDB code 6R6V) and parent naphthalene inhibitor 2 (cyan stick model; PDB code 5NN0) in their complexes with huBChE. (B) Compounds 3A (gray stick model; PDB code 6RUA), 3B (purple stick model; PDB code 6R6W) and parent sulphonamide inhibitor 3 (cyan stick model; PDB code 5DYW) in their complexes with huBChE.
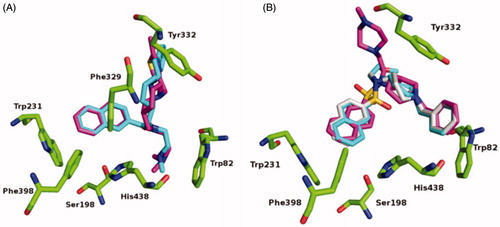
Figure 6. Fluorescence spectra of probes 2C (A) and 3B (B) at 1 μM in the various solvents (as indicated). Excitation wavelengths: 440 nm, 380 nm, for probes 2C, 3B, respectively. a.u., arbitrary units.
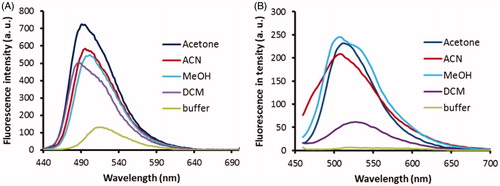
Figure 7. Fluorescence spectra of probes 2C (A) and 3B (B) at 1 μM in buffer without huBChE (blue), with huBChE at 500 nM (red) and with huBChE at 500 nM and inhibitor 2 at 1 μM (green). a.u. – arbitrary units.
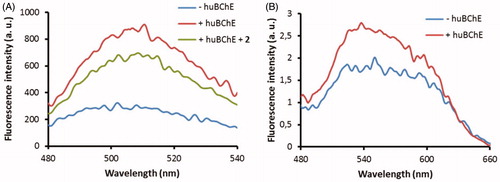
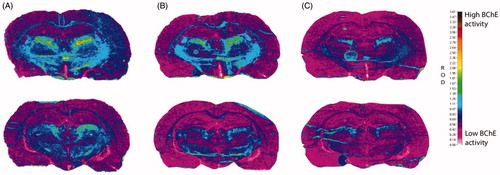
Figure 8. Histochemical staining for BChE activity of coronal cryosections (10 μm) of a rat brain from two regions (top/bottom row) at the level of the thalamus. All sections were processed with 0.1 mM BW-284C51 in Koelle solution, to completely block AChE activity. The sections were incubated in the absence of the probes (A) and with probes 2C (1 mM; B) and 3B (1 mM; C). The relative optical density (ROD) pseudocolor scale for staining intensity of BChE activity is on the right.