Figures & data
Scheme 1. Synthesis of novel embelin derivatives.
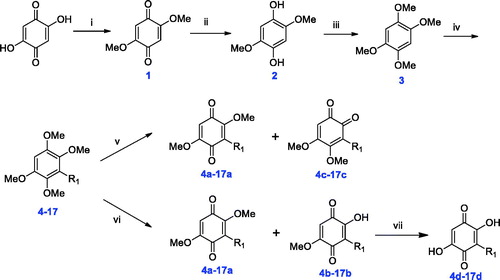
Figure 1. Design of novel embelin derivatives.
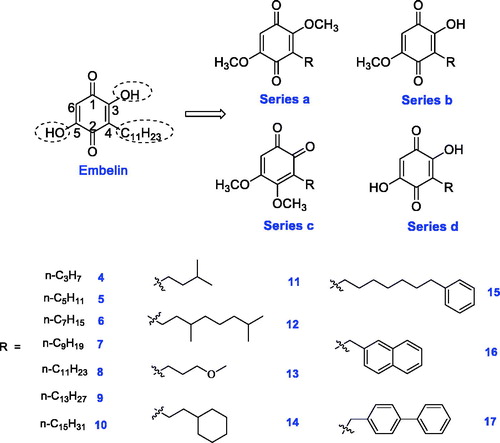
Figure 2. 13C-NMR spectrum of compound 5d.
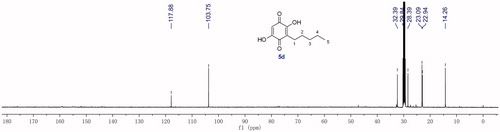
Figure 3. Tautomerism between two forms of para-benzoquinone.
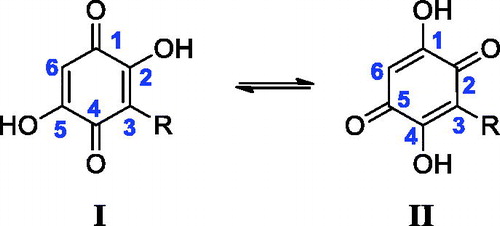
Table 1. Inhibition rate of all compounds at 250 μM against α-glucosidase.
Figure 4. Inhibition curves of embelin and its derivatives.
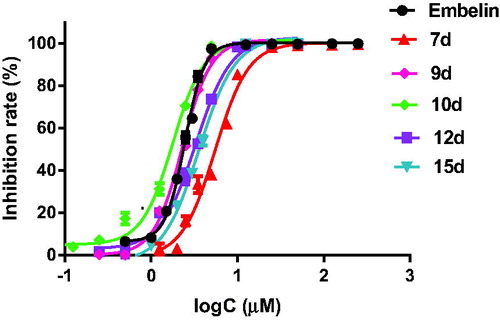
Table 2. IC50 values of selected compounds against α-glucosidase.
Figure 5. Determination of the mechanism of the inhibition of α-glucosidase by 10d, 12d, 15d, and embelin.
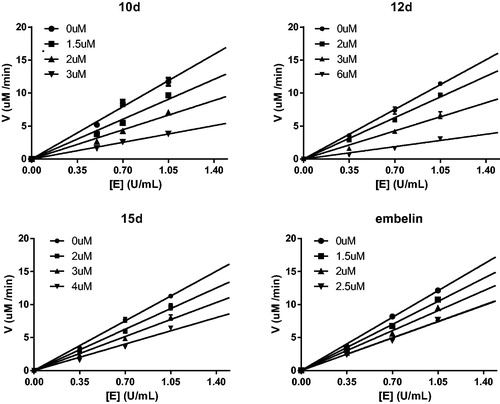
Figure 6. A1–D1: Lineweaver–Burk double-reciprocal plots; A2–D2: Plots of slope versus concentration of inhibitors for the determination of the inhibition constant Ki; A3–D3: Plots of Y-intercept versus concentration of inhibitors for the determination of the inhibition constant Kis.
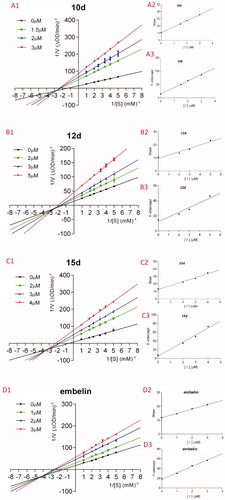
Table 3. Ki, Kis, and inhibition type of selected compounds against α-glucosidase.
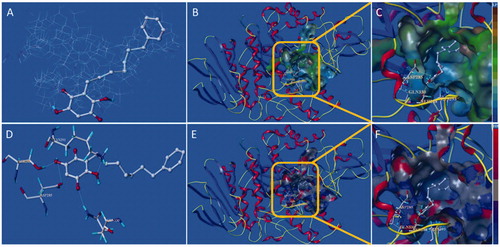
Figure 7. Docking binding model of 10d with yeast α-glucosidase. (A): Binding mode of 10d docked with the prototype molecular of the active site. (B) and (C): Active site MOLCAD surface representation of lipophilic potential. (D): The interaction of 10d with the surrounding amino acids. (E) and (F): Active site MOLCAD surface representation of hydrogen bonding.
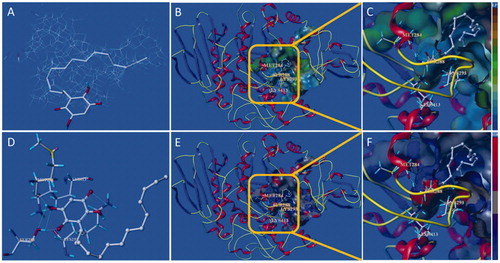
Figure 8. Docking binding model of 15d with yeast α-glucosidase. (A): Binding mode of 15d docked with the prototype molecular of the active site. (B) and (C): Active site MOLCAD surface representation of lipophilic potential. (D): The interaction of 15d with the surrounding amino acids. (E) and (F): Active site MOLCAD surface representation of hydrogen bonding.