
Figures & data
Table 1. The binding affinities and Zn coordination for ilomastat and various derivatives. R represents the Leu-Trp backbone of ilomastat.
Figure 1. General synthesis scheme for derivatives: (1) A (1.0 eq.), CH3NH2/CH3OH (33% CH3NH2 by wt., 10 eq.); (2) B (1.0 eq.), FMOC-Leu-OH (2.0 eq.), DIC (2.0 eq.), Oxyma Pure (2.0 eq.), N,N-Diisopropylethylamine (2.0 eq.); (3) C (1.0 eq.), 20% piperidine in DMF; (4) D (1.0 eq.), chloromethane sulphonyl chloride (7.0 eq.), N,N-Diisopropylethylamine (7.0 eq.).
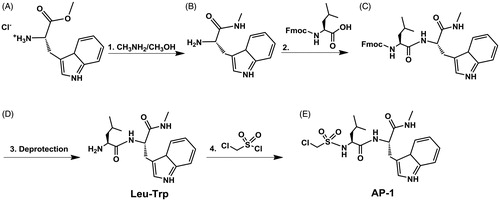
Figure 2. (A) Analysis of MMP3 in C6-Cx43 (C6-13) and low motility C6 parental line confirm MMP3 expression in high motility cellsCitation18,Citation53. (B) Relative to untreated control, zymographic assays of C6-13 conditioned media demonstrate dose-dependent loss of MMP3 activity due to ilomastat (N = 3, significance level *p ≤ 0.05, ***p ≤ 0.001) (C). (D) Structures of the Leu-Trp backbone, ilomastat and sulphonamide derivatives computationally (Leu-Trp to AP-7) and experimentally (Leu-Trp, ilomastat and AP-1) examined in this study.
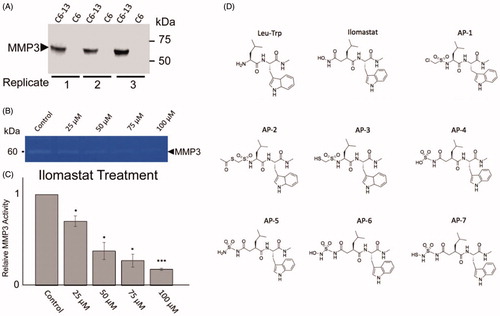
Figure 3. The placement of AP-3, AP-6, AP-7 and ilomastat in MMP3. The colour scheme is green=AP-3, blue=AP-6, yellow=AP-7, and red = ilomastat. Regarding the molecular surface green indicates lipophilic regions and purple indicates low lipophilic regions. The Zn2+ ion is represented by the large light blue coloured sphere.
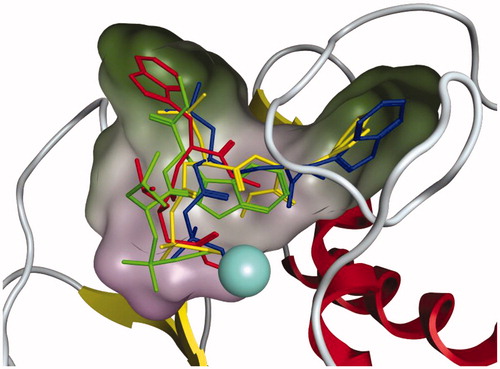
Figure 4. Inhibition of MMP-3 activity detected by NFF-3 assay. Assays were monitored over six hours, relative to untreated controls, 50 μM and 100 μM concentration for each of the listed compounds were compared for: (A) Ilomastat, (B) Leu-Trp, and (C) AP-1. Value reported here represent average, control normalised values performed in triplicate (N = 3), R2 values >0.99. Error bars representing standard error of the mean.
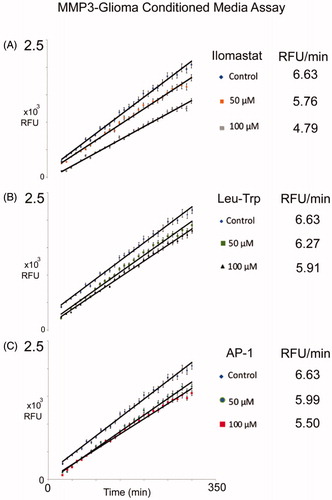
Figure 5. Comparison of MMP3 activity (NFF-3 fluoresence, RFU/min) in the presence of Leu-Trp, AP-1, ilomastat at (A) 50 μM and (B) 100 μM and negative control as a function of calculated binding affinity. Anticipated inhibitory performance of (AP-2, AP-3, AP-4, AP-5, AP-6 and AP-7) are based on linear regression models.
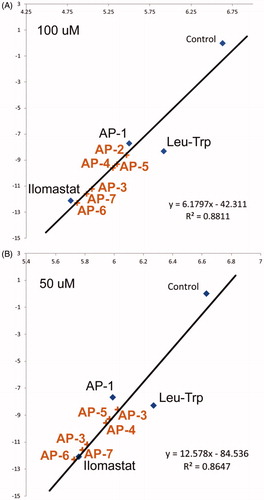
Table 2. Average lengths for key bonds between ligand and MMP3. Average Gibbs binding energies with standard deviations.