
Figures & data
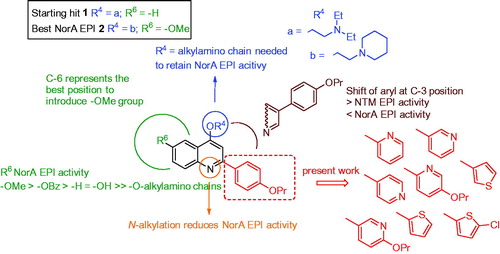
Figure 1. Known SAR around the 2-phenylquinoline scaffold and new designed compounds.
Scheme 1. (i) SOCl2, 60 °C, 30 min; (ii) Et3N, dry THF, rt, 90 min-6 h, 50–99%; (iii) NaOH, dry dioxane, 110 °C, 2–8 h, 57–100%; (iv) chloroalkylamine hydrochloride, K2CO3, dry DMF, 80 °C, 2–12 h, 17–69%.
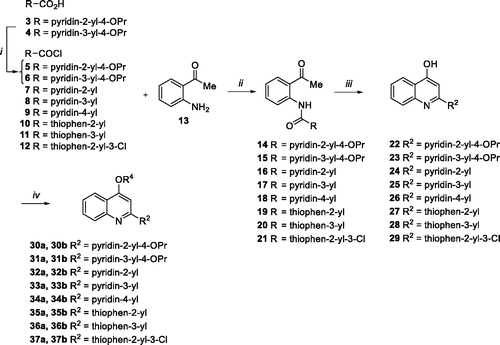
Figure 2. Chequerboard assays of compounds 30a, 30b, 35b, 36b, 37a and reference compounds 1 and 2 in combination with CPX against SA-1199B.
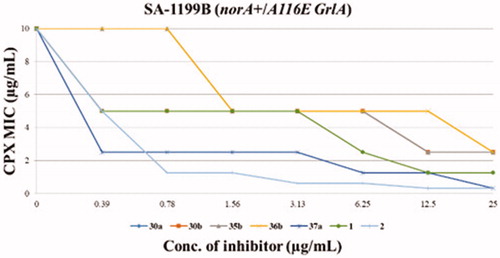
Figure 3. Time-kill curves of CPX and combination of compound 37a with different concentrations of CPX against SA-1199B.
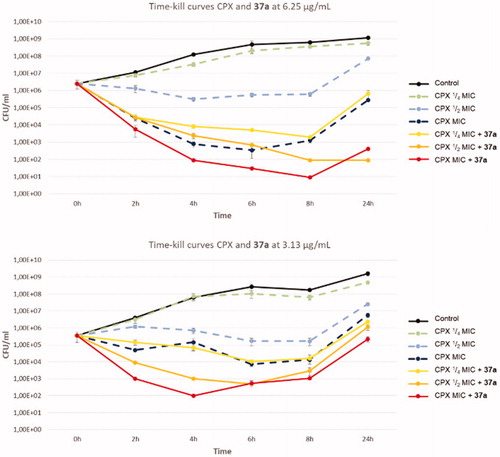
Figure 4. Haemolysis assays of compounds 37a and starting hit 1.
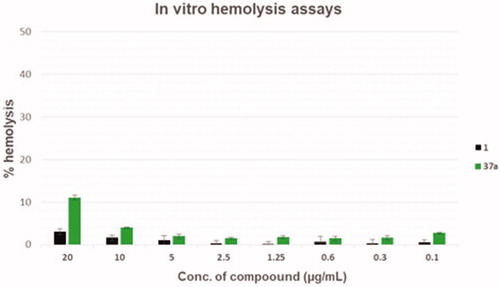
Table 1. Cytotoxicity assays against THP-1 cells of compounds 1, 2 and 37a and their calculated “selectivity index.”
Figure 5. Membrane polarisation assays of compounds 1 and 37a against SA-1199B at three different concentrations (1, 5 and 10 µg/mL) using the BacLight Bacterial Membrane Potential Kit. CCCP was used as positive control at 1 µg/mL (5 µM). % of membrane polarisation was calculated from the red/green fluorescence ratio by comparing bacterial cells in the presence of compounds with untreated cells.
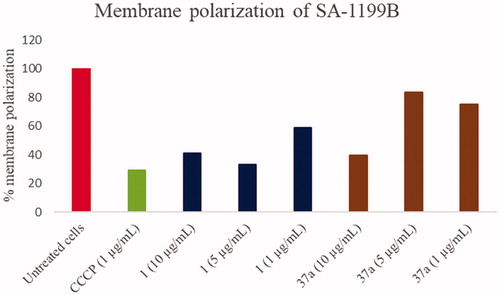
Figure 6. Predicted reactivity for compounds 1 (A), 2 (B) and 37a (C). The atoms are colour-coded based on their predicted reactivity (red: high reactivity; blue: low reactivity). The blue sphere highlights the most probable site of metabolism.
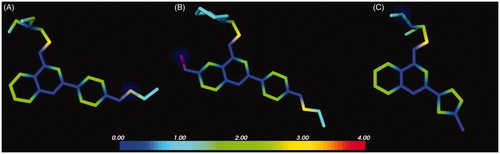
Table 2. Predicted physicochemical and ADME descriptors for derivative 37a.