Figures & data
Figure 1. Aspartic peptidase activity in Phialophora verrucosa conidia. Concentrated supernatant and HSA substrate were incubated with pepstatin A (PEPS, 10 µM), 1,10-phenanthroline (1,10-PHEN, 10 mM), E-64 (10 µM), PMSF (10 mM) and without inhibitors (control). The degradation profile was analysed using SDS-PAGE. The substrate degradation after hydrolysis is indicated by the arrowheads on the right. Bar graph represents the densitometric analysis of the gel bands using ImageJ software. Asterisks indicate p values ≤ 0.05 in comparison with the control system.
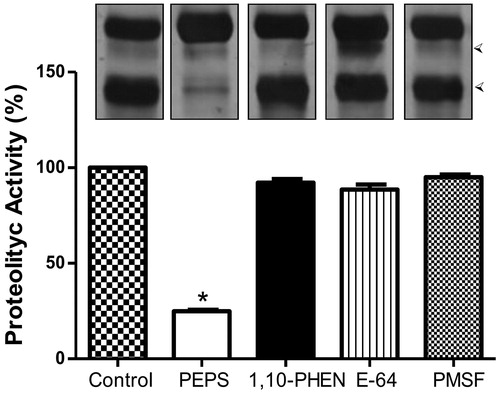
Table 1. Effect of HIV-PIs on the peptidase activity secreted by Phialophora verrucosa.
Figure 2. Effect of HIV-PIs on Phialophora verrucosa growth. Conidia were incubated for 20 h (A): with 400 µM of amprenavir (APV), atazanavir (ATV), indinavir (IDV), lopinavir (LPV), nelfinavir (NFV), ritonavir (RTV), saquinavir (SQV), or in the absence of inhibitors (control) and (B): with variable concentrations of LPV, NFV or RTV. Growth inhibition in all the systems was determined using the colony-forming unit (CFU) assay. The values represent the mean standard deviation of the three independent experiments performed in triplicate. Asterisks indicate p values ≤ 0.05 in comparison with the control system.
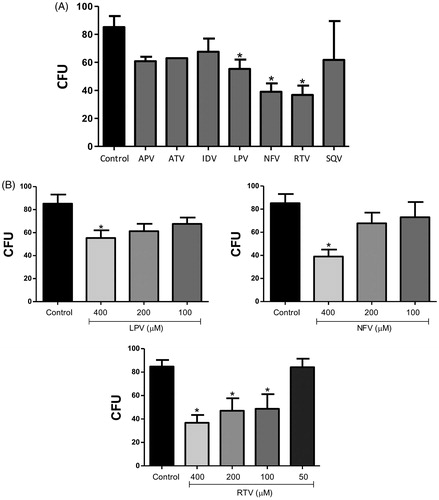
Figure 3. Effect of HIV-PIs on Phialophora verrucosa ultrastructure. Conidia (1 × 10⁶) were incubated for 20 h in RPMI medium in the absence (control) or presence of HIV-PIs and processed by scanning electron microscopy (SEM) as described in Material and Methods. Representative images show untreated (control cells, A, B) and treated cells with lopinavir 400 µM (C); nelfinavir 400 µM (D) ritonavir 200 µM and 400 µM (E, F). SEM analyses demonstrated that HIV-PIs treatment induced different cellular alterations, such as cell re-entrances (E, F; arrows), cell disruption (C-F; arrowheads) and surface deposits (C–F; star). Images were obtained using JEOL JSM-6490 LV scanning electron microscope.
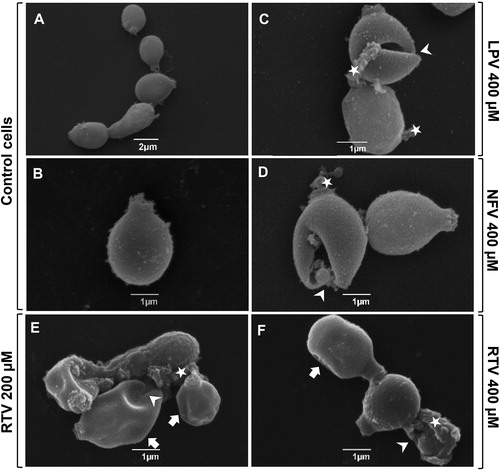
Figure 4. Effect of HIV-PIs on THP-1 viability and Phialophora verrucosa-macrophages interaction. (A) THP-1 macrophages (4 × 10⁵/mL) were incubated with lopinavir (LPV) and ritonavir (RTV), individually or in combination, at different concentrations for 24 h and in the absence of inhibitors (control). After treatment, macrophage viability was determined using the MTT assay. Alternatively, THP-1 cells were infected with P. verrucosa conidia at a ratio of 5:1 (fungi:macrophage) for 1 h and then non-adherent fungi were removed. The cultures were incubated for additional 20 h with non-cytotoxic concentrations of lopinavir and ritonavir, individually or in combination, and in the absence of inhibitors (control). (B) Adhesion index and (C) macrophage killing. The results were expressed considering the viability of control (untreated cells) as 100%. Asterisks indicate p values ≤0.05 in comparison with the control system. Inset: Representative images of attached fungus (arrows) to macrophages are shown by light microscopy analyses.
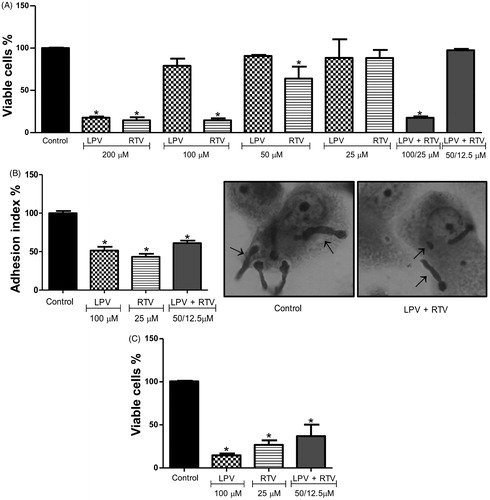
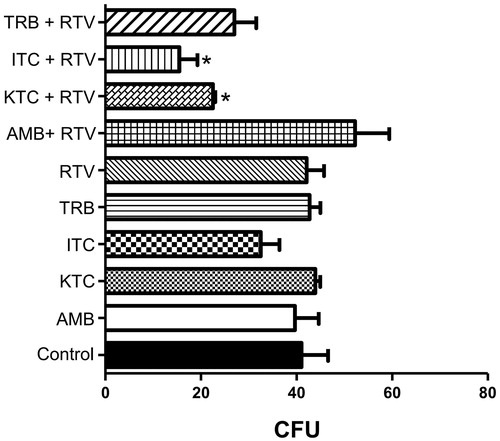
Figure 5. Effect of ritonavir combined with antifungal drugs on Phialophora verrucosa growth. Conidia (5 × 10²) were incubated with ritonavir (RTV, 50 µM), individually or in combination with amphotericin B (AMB, 2.5 µM), ketoconazole (KTC, 5.0 µM), itraconazole (ITC, 1.2 µM) or terbinafine (TRB, 5.0 µM), and in the absence of drugs (control) at 26 °C for 20 h at subinhibitory concentrations. All antifungal drugs were also tested individually at the same concentrations. Then, the growth inhibition was determined using colony-forming unit (CFU) assay. The values represent the mean standard deviation of the three independent experiments performed in triplicate. (*p < 0.05; Student t test).