Figures & data
Table 1. Concentration of daily AlkaWater’s elements consumption from mice.
Table 2. Salts present in AlkaWater®.
Figure 1. Experimental study design. Evaluation of the antiaging effects of alkaline water supplementation (AWS) (pH 9.0) on C57BL/6J female mice. The treatment with AWS continued for 10 months, starting from 6 weeks of mice age until 51 weeks of mice age, corresponding to the fertile window of human women (13–41 years old).
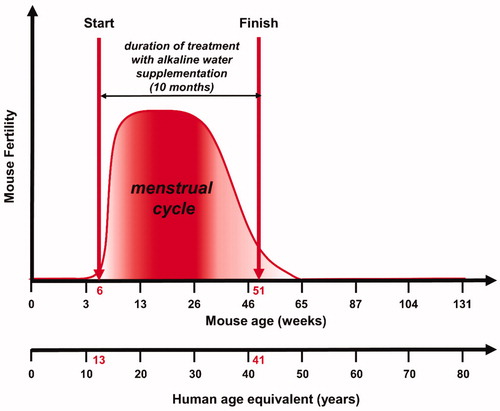
Figure 2. Telomerase (TE) concentration in plasma samples from C57BL/6J female mice treated with alkaline water supplementation (AWS). Quantitative determination of mouse telomerase (TE) concentrations (ng/mL) was performed on the same volume by a colorimetric sandwich-ELISA assay on plasma samples obtained from untreated (CTR group) and treated (AWS group) mice immediately before the sacrifice. CTR group mice received tap water (pH = 7) every day, while AWS group mice were treated orally with AWS (pH = 9.0) for 10 months, every day without interruption, until the sacrifice of the animals. The optical density (OD) is measured to the spectrophotometer at 450 ± 2 nm. Data are normalised on total plasma and expressed as means ± SE. *p < 0.05.
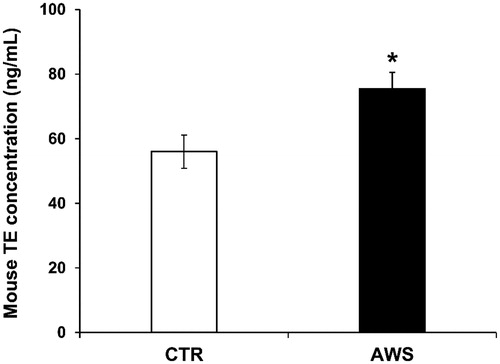
Figure 3. Bone marrow cells number in C57BL/6J female mice. Bone marrow was isolated from both mice tibias and femurs of the hind legs of CTR group and AWS group immediately after the sacrifice, and the resulting bone marrow cells were counted by trypan blue exclusion under optical microscope. ****p < 0.0001.
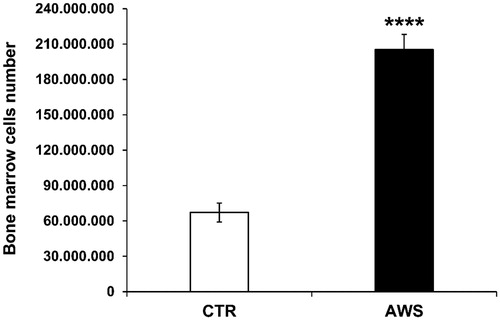
Figure 4. Effect of AWS on length of telomeres in bone marrow cells from C57BL/6J female mice. The analysis of telomeres length mouse was performed on nucleated haematopoietic cells from bone marrow by a fluorescein-conjugated peptide nucleic acid (PNA) probe kit. Cells were obtained from both CTR and AWS groups immediately after the sacrifice. Results are obtained by flow cytometry with excitation at 488 nm. Data are expressed as mean ± SE of mean intensity fluorescence (M.I.F.) normalised on total cells. ****p < 0.0001.
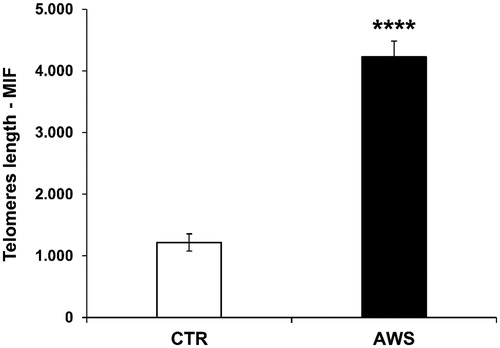
Figure 5. Ovarian germ cells number in C57BL/6J female mice. Ovaries were isolated from both CTR and AWS groups immediately after the sacrifice, and the resulting ovarian germ cells were counted by trypan blue exclusion under optical microscope. **p < 0.005.
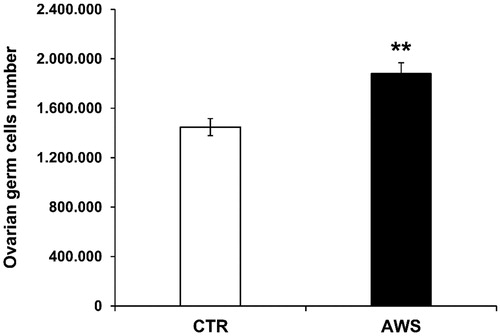
Figure 6. Effect of AWS on length of telomeres in ovarian germ cells from C57BL/6J female mice. The analysis of telomeres length mouse was performed on ovarian germ cells from both CTR and AWS groups immediately after the sacrifice, by using a fluorescein-conjugated peptide nucleic acid (PNA) probe kit. Results are obtained by flow cytometry with excitation at 488 nm. Data are expressed as mean ± SE of mean intensity fluorescence (M.I.F.) normalised on total cells. ****p < 0.001.
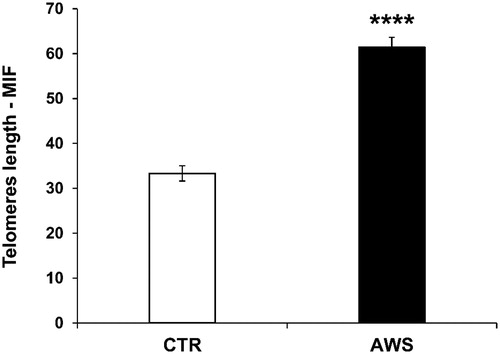
Figure 7. AWS effect on total ROS blood levels in C57BL/6J female mice. Analysis of the total ROS levels (arbitrary units, a.u.) on the plasma samples collected from both CTR and AWS groups immediately before the sacrifice. Analysis of the total ROS levels was performed with a colorimetric assay and measured on a spectrophotometer off the 488 nm (blue laser) in the FITC channel. Data are normalised on total plasma and expressed as means ± SE. **p < 0.005.
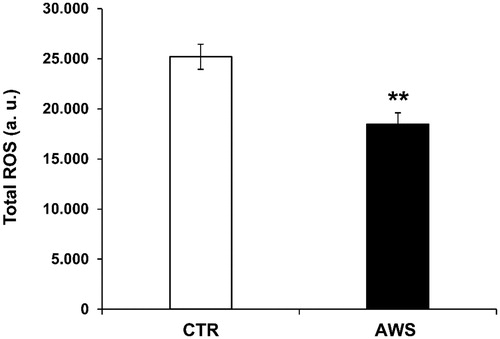
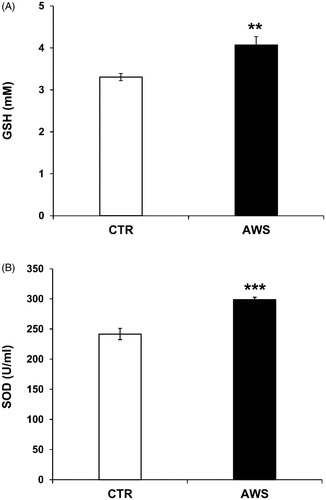
Figure 8. AWS antioxidant effect in C57BL/6J female mice by measuring the plasma antioxidant levels (GSH and SOD-1). Analysis of the total antioxidant activity (glutathione GSH and superoxide dismutase SOD-1) in plasma samples collected from both CTR and AWS groups immediately before the sacrifice. (A) Analysis of the quantification and detection of GSH activity (mM) was performed by a colorimetric activity assay and the concentration was determined by measuring the absorbance at 405 nm. (B) Analysis of the quantification and detection of SOD-1 activity (U/mL) was performed by a colorimetric activity assay and the absorbance was read at 450 nm. Data are normalised on total plasma and expressed as means ± SE. **p < 0.01, ***p < 0.001.