Figures & data
Table 1. Identification of lipopeptides produced by B. velezensis FJAT-52631 using LC-QTOF-MS/MS.
Figure 1. The full scan LC-ESI-MS chromatogram of fraction eluted using 80% methanol.
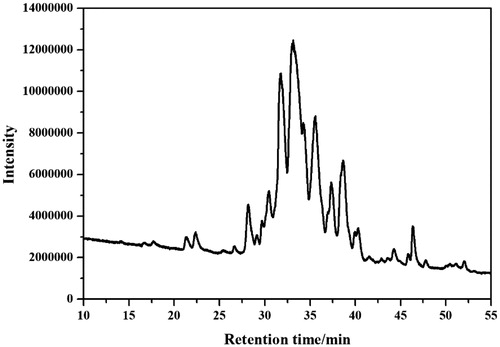
Figure 2. The full scan LC-ESI-MS chromatogram of (a) iturin and (b) surfactin standards.
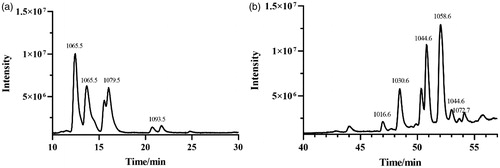
Figure 3. Lipase inhibitory activity of (a) crude lipopeptide, (b) purified fengycin, (c) iturin, and (d) surfactin.
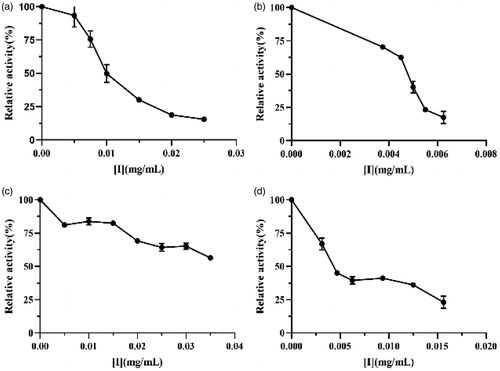
Figure 4. Inhibition mechanisms of (a) crude lipopeptide, (b) fengycin, and (c) surfactin on lipase.
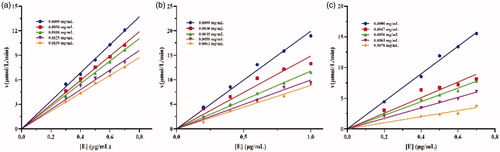
Figure 5. Inhibition types of (a), crude lipopeptide, line 5-1: mean 0, 0.0013, 0.002, 0.0025, 0.003 mg/mL, respectively; (b) fengycin, line 5-1: mean 0, 0.0013, 0.002, 0.0025, 0.003 mg/mL, respectively; and (c) surfactin, line 5-1: mean 0, 0.0008, 0.0009, 0.0011, 0.0013 mg/mL, respectively on lipase.
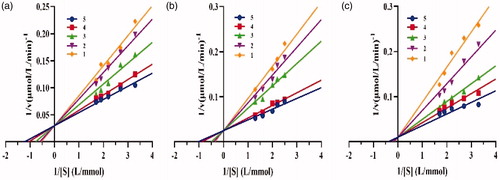
Table 2. Inhibition effects of lipopeptides for lipase.
Figure 6. Consecutive spectra obtained during the lipase catalysis in the (a) absence and (b) presence of crude lipopeptide. Curves 1–10 depict the addition of the enzyme in 10 min.
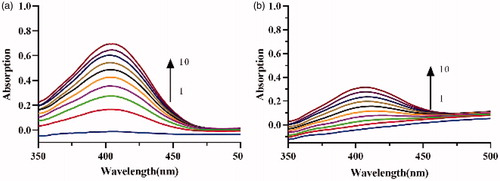
Figure 7. Effect of lipopeptides on the emission spectrum of lipase. (a) Emission spectra of lipase with crude lipopeptide concentration of 0, 0.194, 0.265, 0.324, 0.375, 0.419, and 0.457 mg/mL, respectively (1–7, respectively); (b) Florescence intensity changes with lipopeptide; (c) Plot of F0−F against [I] for lipopeptide; (d) Plot of lg[(F0−F)/F] versus lg[I] for lipopeptide.
![Figure 7. Effect of lipopeptides on the emission spectrum of lipase. (a) Emission spectra of lipase with crude lipopeptide concentration of 0, 0.194, 0.265, 0.324, 0.375, 0.419, and 0.457 mg/mL, respectively (1–7, respectively); (b) Florescence intensity changes with lipopeptide; (c) Plot of F0−F against [I] for lipopeptide; (d) Plot of lg[(F0−F)/F] versus lg[I] for lipopeptide.](/cms/asset/50182915-5e08-44c2-83e9-20f7cee7a467/ienz_a_1734798_f0007_c.jpg)
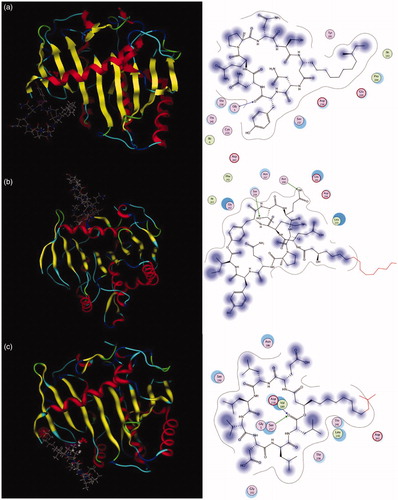
Figure 8. Interactions between key amino acids in (a) lipase and iturin, (b) fengycin, or (c) surfactin were investigated by in silico modelling.