
Figures & data
Scheme 1. Structures of the studied compounds: rosmarinic acid, caffeic acid, salvianic acid, ibuprofen and warfarin.
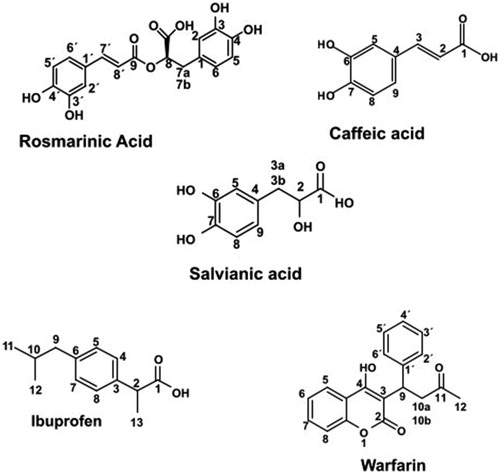
Figure 1. Hydrolysis of rosmarinic acid.
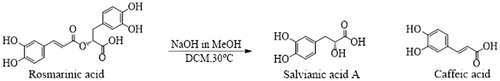
Table 1. Reaction conditions tested to identify the optimum reaction conditions obtaining salvianic acid from rosmarinic acid.
Figure 2. Fluorescence spectra of the interaction of BSA (2 μΜ) with (a) rosmarinic acid (A–Χ: 0–20 μΜ), (b) caffeic acid (A–Χ: 0–20 μΜ) and (c) salvianic acid (A–Χ: 0–20 μΜ).
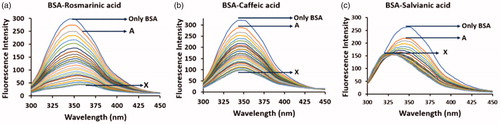
Figure 3. (a) 1H NMR reference spectrum of the complex rosmarinic acid (2 mM) – BSA (20 μM) in Tris-d11 buffer 10 mM, pH = 7.4 with 600 μL D2O. (b) STD difference NMR spectrum of the complex rosmarinic acid–BSA. The percentages values show the STDAMP for all the protons of rosmarinic acid.
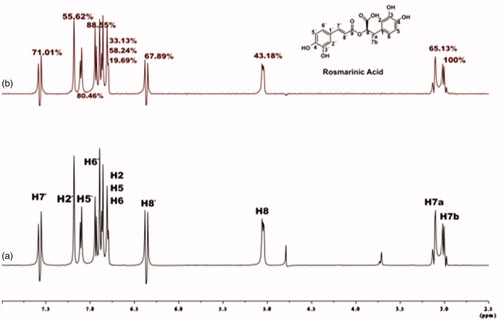
Figure 4. Relative STDAMP (saturation transfer difference amplification factor) values of the saturated protons (regarding their binding to BSA) of rosmarinic acid (black) and its submoieties, caffeic acid (red) and salvianic acid (blue). The values in each molecule are normalised to the intensity of the signal with the largest STD effect.
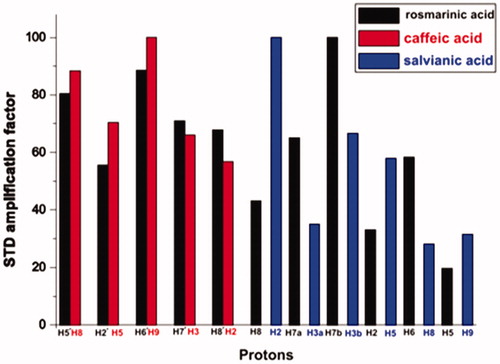
Figure 5. (a) Expanded region of tr-NOESY spectrum of the complex rosmarinic acid–BSA, recorded with mixing time of 350 ms at 600 MHz, showing the presence of negative NOEs of bound ligand. (b) Expanded region of tr-NOESY spectrum of the complex caffeic acid–salvianic acid–BSA, recorded with mixing time of 700 ms at 800 MHz showing the presence of negative NOEs, which are related to the protons of caffeic acid (labelled in red) and presence of positive NOEs, which are related to the protons of the major stereoisomer of salvianic acid (labelled in blue). For the minor isomer of salvianic acid only trivial NOEs between the H2 and H3 protons, which are overlaid with the zero-order artefacts of scalar coupling, are present.
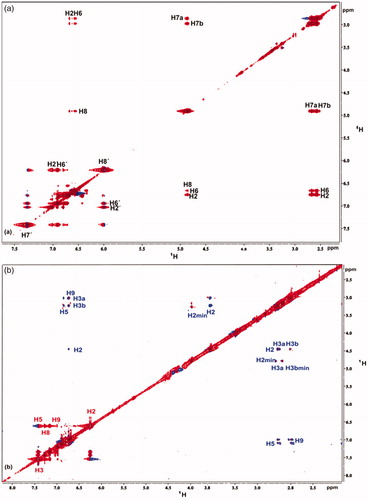
Figure 6. (a) 1H NMR reference spectrum of the complex rosmarinic acid (2 mM) – BSA (50 μΜ), including warfarin 2 mM, in PBS buffer 10 mM, pH = 7.4 with 600 μL D2O. STD difference NMR spectrum of the complex rosmarinic acid–BSA, including: (b) 2 mM warfarin. (c) 4 mM warfarin (d) 6 mM warfarin. (e) 8 mM warfarin (details for the protons of rosmarinic acid in and for warfarin in Supplementary Figure S13).
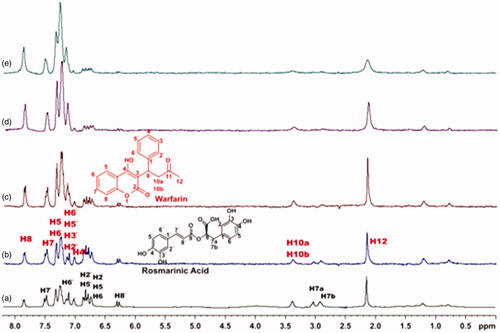
Figure 7. (a) 1H NMR reference spectrum of the complex caffeic acid (2 mM) – BSA (50 μΜ), including warfarin 2 mM, in PBS buffer 10 mM, pH = 7.4 with 600 μL D2O. STD difference NMR spectrum of the complex caffeic acid–BSA, including: (b) 2 mM warfarin, (c) 4 mM warfarin, (d) 6 mM warfarin, (e) 8 mM warfarin (details for the protons of caffeic acid in Supplementary Figure S5 and for warfarin in Supplementary Figure S13).
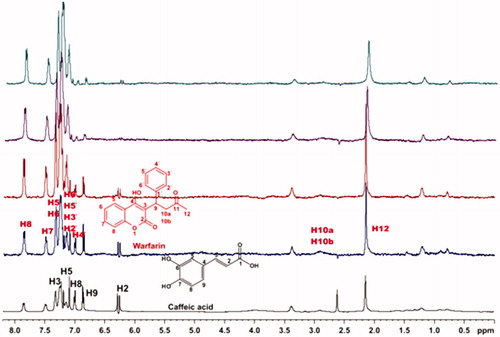
Figure 8. (a) 1H NMR reference spectrum of the complex salvianic acid (2 mM) – BSA (50 μΜ), including warfarin 2 mM, in PBS buffer 10 mM, pH = 7.4 with 600 μL D2O. STD difference NMR spectrum of the complex salvianic acid–BSA, including: (b) 2 mM warfarin, (c) 4 mM warfarin (details for the protons of salvianic acid in Supplementary Figure S6 and for warfarin in Supplementary Figure S13).
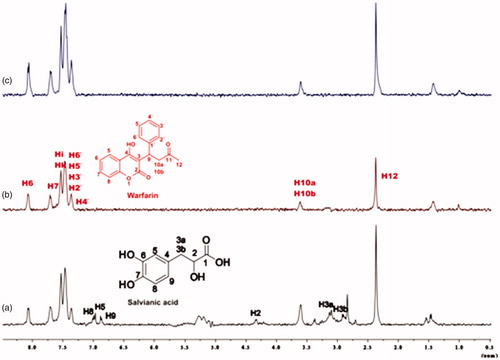
Figure 9. (a) 1H NMR reference spectrum of the complex rosmarinic acid–warfarin–BSA (0.2 mM:2 mM:20 μΜ), in Tris buffer 10 mM, pH = 7.4. (b) STD difference spectrum of the complex rosmarinic acid–warfarin–BSA (0.2 mM:2 mM:20 μΜ), in Tris buffer 10 mM, pH = 7.4. (c) 1H NMR reference spectrum of the complex salvianic acid–warfarin–BSA (0.2 mM:2 mM:20 μΜ), in Tris buffer 10 mM, pH = 7.4 (d) STD difference spectrum of the complex salvianic acid–warfarin–BSA (0.2 mM:2 mM:20 μΜ), in Tris buffer 10 mM, pH = 7.4 (details for the protons of rosmarinic acid in , for salvianic acid in Supplementary Figure S6 and for warfarin in Supplementary Figure S13).
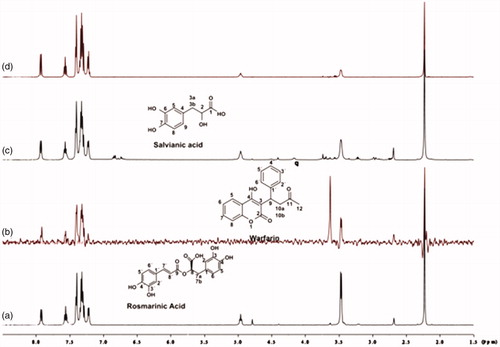
Figure 10. (a) 1H NMR reference spectrum of the complex rosmarinic acid (2 mM) BSA (50 μΜ), including ibuprofen 2 mM, in PBS buffer 10 mM, pH = 7.4 with 600 μL D2O. STD difference NMR spectrum of the complex rosmarinic acid–BSA, including: (b) 2 mM ibuprofen (c) 4 mM ibuprofen (details for the protons of rosmarinic acid in and for ibuprofen in Supplementary Figure S14).
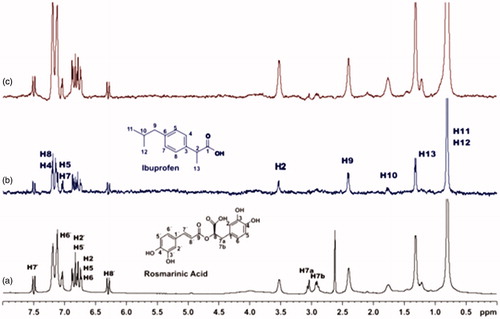
Figure 11. (a) 1H NMR reference spectrum of the complex caffeic acid (2 mM) – BSA (50 μΜ), including ibuprofen 2 mM, in PBS buffer 10 mM, pH = 7.4 with 600 μL D2O. STD difference NMR spectrum of the complex caffeic acid–BSA, including: (b) 2 mM ibuprofen (c) 4 mM ibuprofen (details for the protons of caffeic acid in Supplementary Figure S5 and for ibuprofen in Supplementary Figure S14).
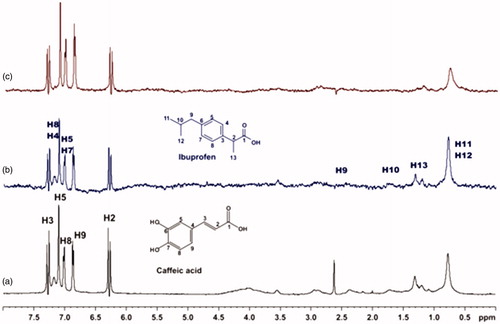
Figure 12. (a) 1H NMR reference spectrum of the complex salvianic acid (2 mM) – BSA (50 μΜ), including ibuprofen 2 mM, in PBS buffer 10 mM, pH = 7.4 with 600 μL D2O. STD difference NMR spectrum of the complex salvianic acid–BSA, including: (b) 2 mM ibuprofen, (c) 4 mM ibuprofen (details for the protons of salvianic acid in Supplementary Figure S6 and for ibuprofen in Supplementary Figure S14).
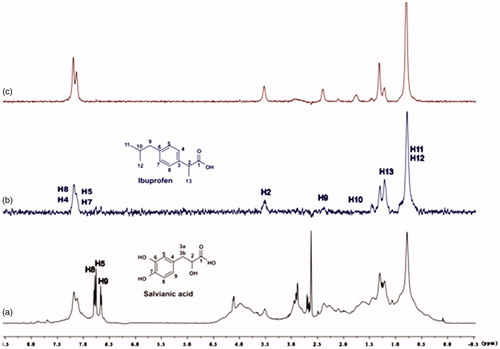
Figure 13. (a) 1H NMR reference spectrum of the complex ibuprofen (2 mM) BSA (20 μΜ), including salvianic acid 0.2 mM, in Tris-d11 buffer 10 mM, pH = 7.4 with 600 μL D2O. STD difference NMR spectrum of the complex ibuprofen–BSA, including: (b) 0.2 mM salvianic acid, (c) 3 mM salvianic acid (details for the protons of salvianic acid in Supplementary Figure S6 and for ibuprofen in Supplementary Figure S14).
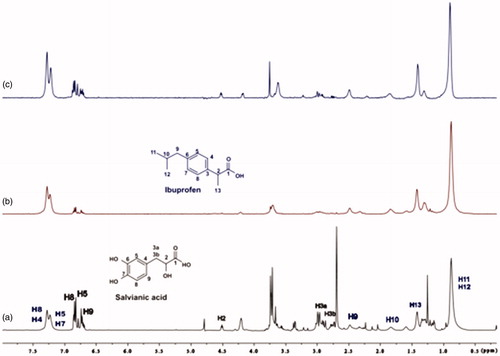
Figure 14. Isothermal titration calorimetry measurements for the interaction of BSA with (a) Rosmarinic acid and (b) Caffeic acid. For each interaction the isotherm plot (up) and the fitting of the integrated curve (down) are being presented.
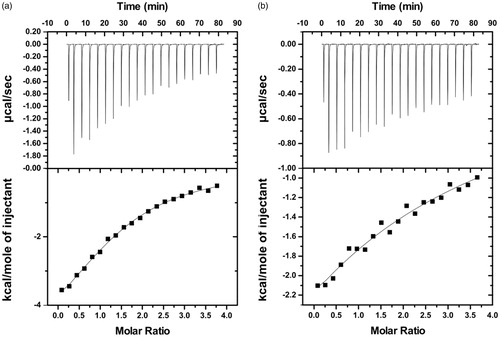
Table 2. Thermodynamic parameters and binding affinities of the BSA interaction with rosmarinic and caffeic acid.
Figure 15. Best pose of rosmarinic acid in Sudlow site I. The nine favourable hydrogen bonds and π-π stacking between Arg256 and aromatic ring A (Supplementary Figure S17) can explain its highly favourable binding.
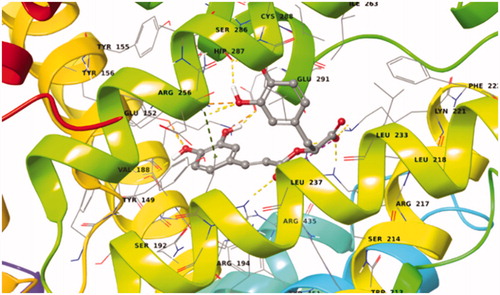
Figure 16. Binding interactions of caffeic acid in Sudlow site I of BSA.
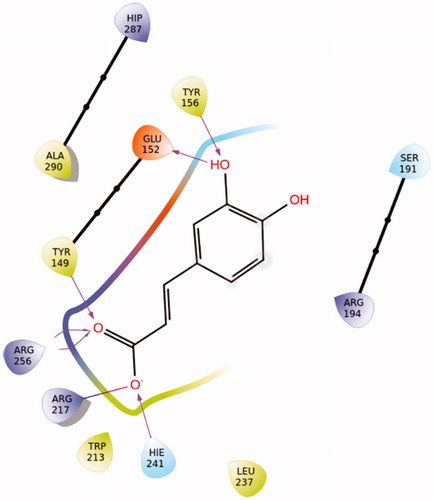
Figure 17. Best pose of BSA–salvianic acid in Sudlow site I. The four favourable hydrogen bonds, the salt bridge between Arg198–carboxylic anion and the π–cation can explain its highly favourable binding.
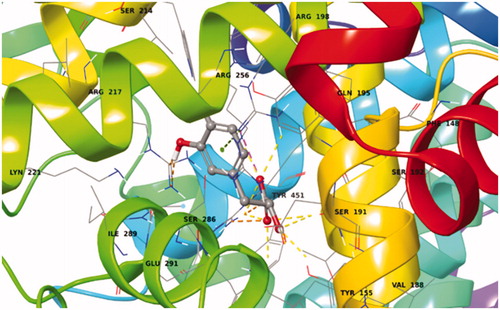
Table 3. Hydrogens’ distances (presenting tr-NOE signals) in their best pose conformations in Sudlow’s I cavity.