Figures & data
Figure 1. Structures of several ATAD2 inhibitors.
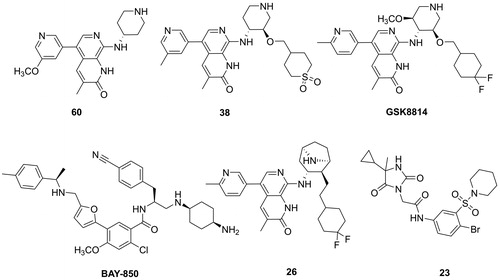
Figure 2. Virtual screening schematic model for the discovery process of novel ATAD2 inhibitors.
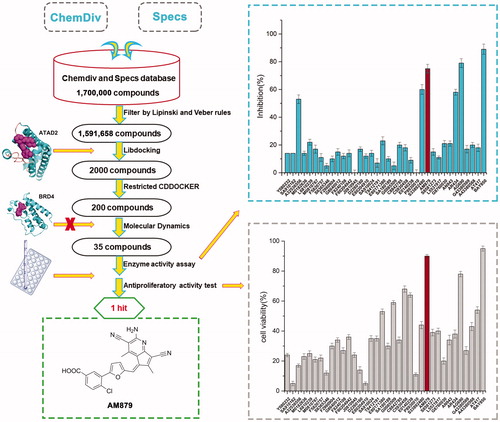
Table 1. The chemical structures of selected candidates.
Figure 3. AM879 is a novel potent ATAD2 Bromodomain inhibitor. (B) The time evolution of RMSD of backbone atoms for the residues around 5 Å of AM-879 and heavy atoms of AM879 (C) The detailed interaction between AM-879 and ATAD2. (D) The polar (sky blue) and nonpolar (yellow orange) interaction surface between AM879 and ATAD2. (E) Inhibitory effect of AM879 on ATAD2 Bromodomain.
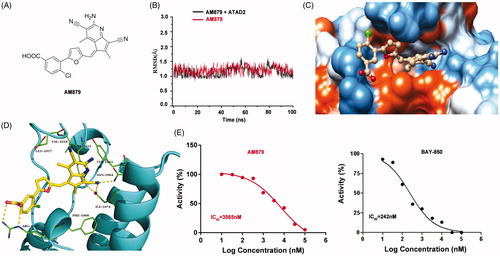
Table 2. The binding free energies were calculated by MM-GBSA method (kcal/mol)
Table 3. Binding affinities of AM-879 were measured by TR-FRET against ATAD2 and the first and second bromodomains of BRD2, BRD3 and BRD4.
Figure 4. AM879 inhibits ATAD2 activity in MDA-MB-231 cells. (A) MTT assays were performed to measure the antiproliferative potency of AM879 against MDA-MB-231 cells. (B) MDA-MB-231 cells were treated with 2.5 µM AM879 then the expression of ATAD2 was detected by immunocytochemistry. Green: anti-ATAD2; Blue: DAPI. Scale bar = 50 µm. (C) MDA-MB-231 cells were treated with 2.5 µM AM879 then the expression of p-cMyc was detected by immunocytochemistry. Green: anti-p-cMyc. Scale bar = 50 µm. (D) Cells were treated with 1.25, 2.5 and 5.0 µM AT879 for 24 h, then the expressions of ATAD2, c-Myc and p-cMyc were detected by western blot analysis. β-actin was measured as the loading control.
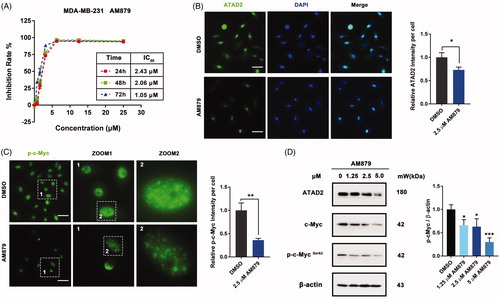
Figure 5. AM879 induced apoptosis in breast cancer cells. (A) MDA-MB-231 cells were treated with 2.5 μM AM879 for 24 h, apoptosis was evaluated by TUNEL assay. Scale bar= 40 μm. (B) MDA-MB-231 cells were treated with 1.25, 2.5 and 5 μM AM879 for 24 h, apoptosis ratios were determined by flow cytometry analysis of Annexin-V/PI double staining. (C)Western blot analysis of Bax, Bcl-2, Caspase8 and Caspase3 in MDA-MB-231 cells treated with 1.25, 2.5 and 5 μM AM879 for 24 h. Relative Bax, Bcl-2, Caspase8 and Caspase3 expression levels were quantified by normalisation to β-actin. ns, not significance; *p < 0.05, **p < 0.01, ***p < 0.001 and ****p < 0.0001, compared to DMSO treated Control.
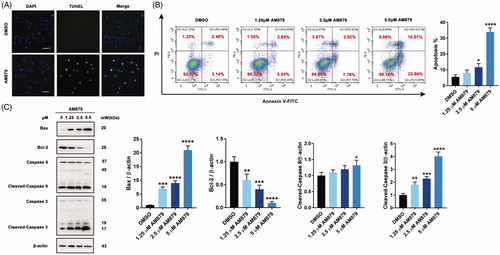
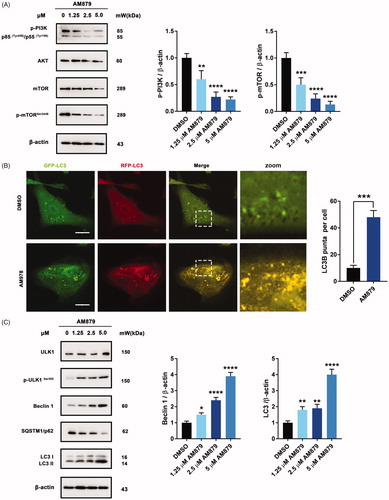
Figure 6. AM879 induced autophagy in MDA-MB-231 cells. (A) Western blot analysis of p-PI3K, AKT, mTOR, p-mTORSer2448 in MDA-MB-231cells treated with 1.25, 2.5, 5 µM of AM879 for 24 h. The relative p-PI3K and p-mTORSer2448 expression levels were quantified by normalisation to β-actin. **p < 0.01, ***p < 0.001 and ****p < 0.0001. (B) Representative immunofluorescence images of LC3 puncta in MDA-MB-231 cells transiently expressing GFP-mRFP-LC3 plasmid followed by treatment of AM879 for 24 h. The number of LC3 puncta per cell was quantified by Image J software, ***p < 0.001. Scale bar = 10 μm. (C)Western blot analysis of ULK1, p-ULK1Ser555, Beclin 1, SQSTM/p62 and LC3 in MDA-MB-231cells treated with 1.25, 2.5, 5 µM of AM879 for 24 h. The relative Beclin1 and LC3-II expression levels were quantified by normalisation to β-actin. *p < 0.05, **p < 0.01 and ****p < 0.0001.