Figures & data
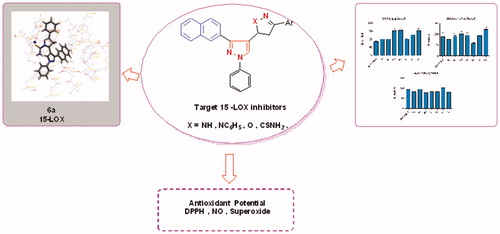
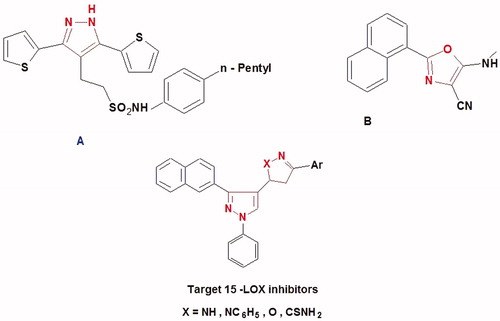
Figure 1. Biologically active compounds have pyrazole ring.
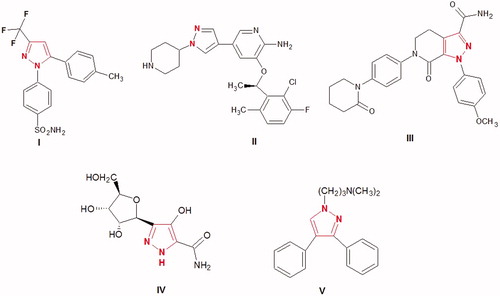
Figure 2. Structure of the lead antioxidant pyrazole derivatives and the designed target compounds 2–6.
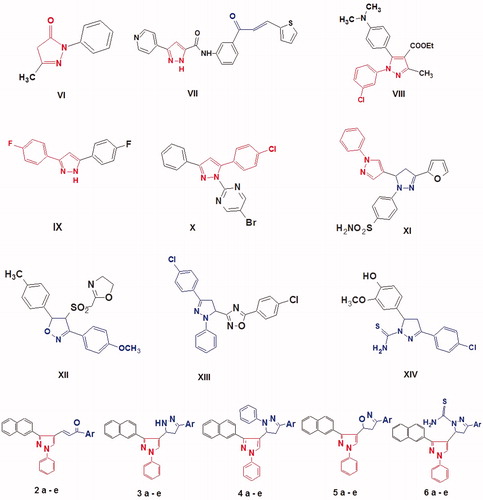
Figure 3. Design strategy of new pyrazole hybrid compounds as 15-LOX inhibitors.
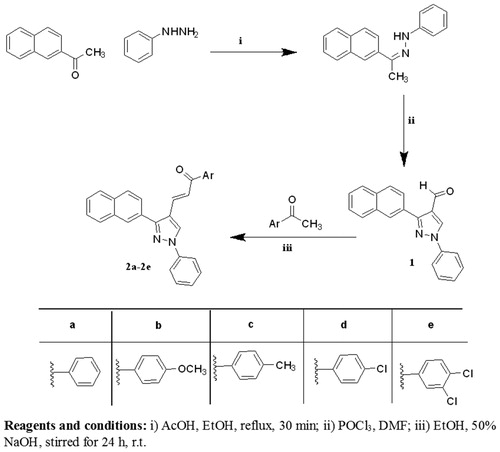
Scheme 1. Synthesis of the designed compounds 1 and 2 (a–e).
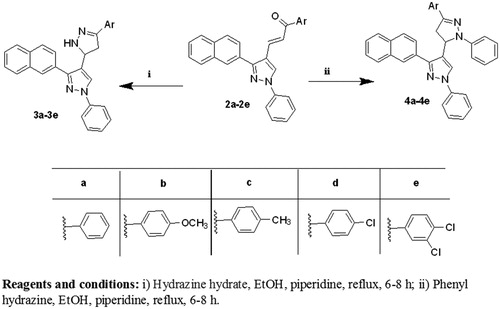
Scheme 2. Synthesis of the designed compounds 3 (a–e) and 4 (a–e).
Scheme 3. Synthesis of the designed compounds 5 (a–e) and 6 (a–e).
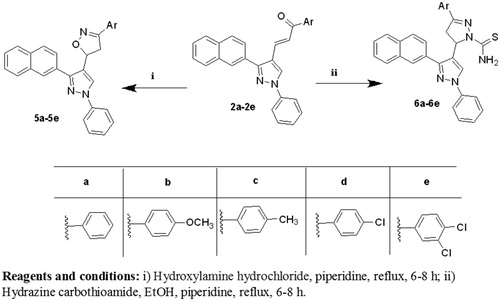
Figure 4. Proposed reaction mechanism for the formation of pyrazole-carbothioamide.
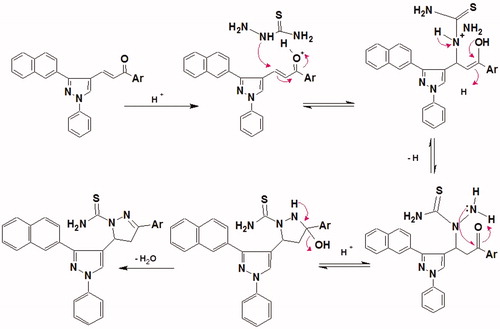
Table 1. In vitro antioxidant potential and 15-LOX inhibition activity of compounds (2–6).
Figure 5. Structure activity relationship of the pyrazole derivatives against DPPH radical scavenging assay.
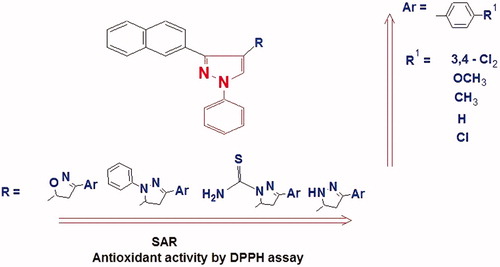
Figure 6. Effect of compounds (3a, 4e, 5 b, 5c, 6a, 6c, 6e) and ascorbic acid on the endogenous antioxidant status of rats. GSH: reduced glutathione; TBARS: thiobarbituric acid reactive substances. Data are expressed as mean ± SEM% control. (n = 6). *, **, and *** p < 0.05, p < 0.01, and p < 0.001 compared to control group.
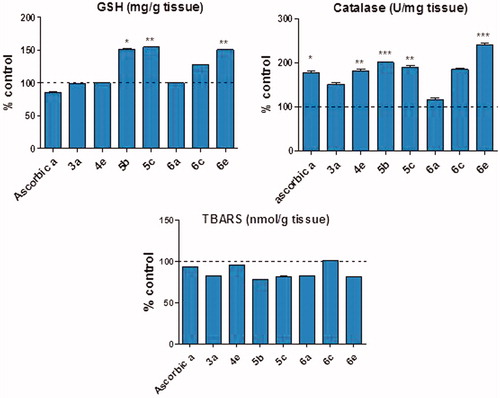
Table 2. In vivo antioxidant potential of compounds.
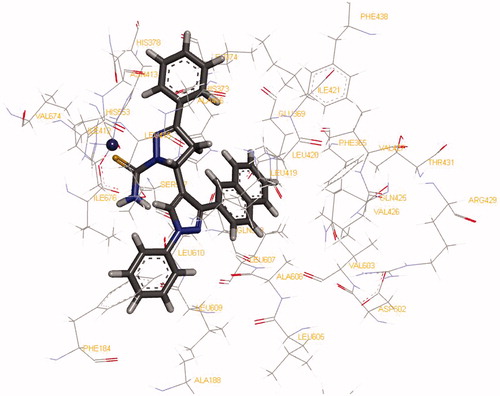
Figure 7. Molecular modelling of 15-LOX inhibitors 6a (coloured by element), into the active binding site of human 15-LOX (PDB: 4NRE), tagging the protein residues that coordinate with Fe3+ catalytic metal (blue ball) and that interacted with the inhibitors.