
Figures & data
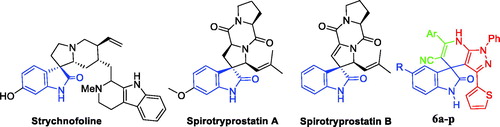
Figure 1. Chemical structure of some naturally isolated anticancer spirooxindoles, and the synthetic spirooxindoles 6a–p.
Scheme 1. Synthesis of target compounds 6a–p; Reagents and conditions: (i) CH3CN, DMF, NaH, benzene, reflux 4 h; (ii) Ethanol, phenylhydrazine, reflux 1 h; (iii) HOAc/H2O (1:1 v/v), heating at 120 °C, 8–11 h.
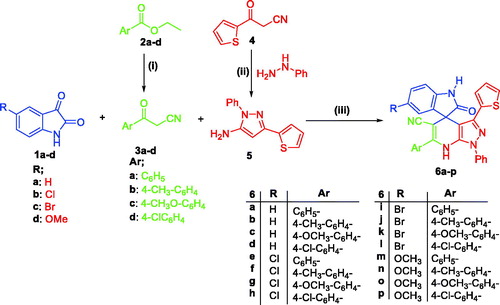
Table 1. Anti-proliferative activities of spirooxindoles 6a–p against HepG2 hepatocellular carcinoma and PC-3 prostate cancer cell lines.
Figure 2. Morphological changes following 48 h exposure of HepG2 cells to indicated concentrations of 6a, 6e and 6i. Signs of toxicity indicated with arrows represent cell rounding, shrinkage and/or loss of monolayer integrity. Total magnification = 300.
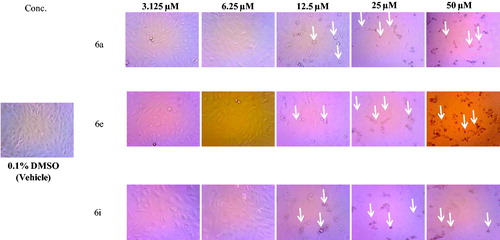
Table 2. Cytotoxic action of spirooxindoles 6a–c, 6e, 6f, 6i–k and 6 m towards non-tumorigenic human MCF-10A cell line, and selectivity index (S. I.) for tumour cells (MCF-10A/HepG2).
Figure 3. Effect of spirooxindole 6a on the phases of cell cycle of HepG2 cells.
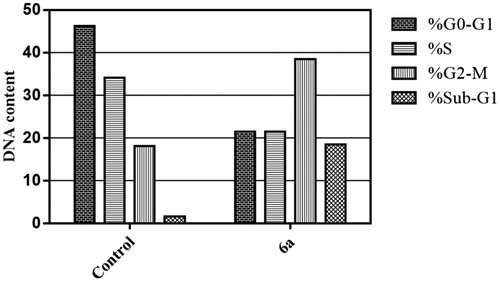
Table 3. Effect of compound 6a on the expression levels of Bax and Bcl-2 in HepG2 cells treated with the compound at its IC50.
Table 4. Effect of compound 6a on the expression levels of active caspases-3 and -9, and p53 in HepG2 cells treated with the compound at its IC50.
Figure 4. Effect of spirooxindole 6a on the percentage of annexin V-FITC-positive staining in HepG2 cells. The experiments were done in triplicates. The four quadrants identified as: LL: viable; LR: early apoptotic; UR: late apoptotic; UL: necrotic.
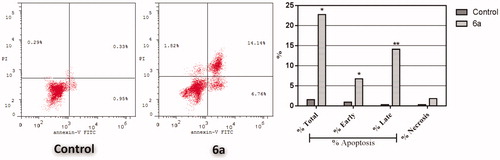
Table 5. The in vitro antioxidant activity of spirooxindoles (6a–p) in DPPH˙ scavenging assay.
Table 6. The in vitro antioxidant activity of spirooxindoles (6a–p) in FRAP assay.
Figure 5. (A) Predicted Boiled-Egg plot from swissADME online web tool for spirooxindole 6a; (B) Bioavailability radar chart for spirooxindole 6a; The pink area represents the range of the optimal property values for oral bioavailability and the red line is spirooxindole 6a predicted properties.
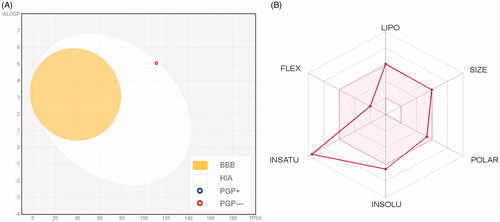
Table 7. In silico predictions of the pharmacokinetics properties for spirooxindole 6a.
Table 8. In silico predictions of the drug-likeness properties for spirooxindole 6a.