
Figures & data
Figure 1. Competitive model of an intra-site differential inhibitor.
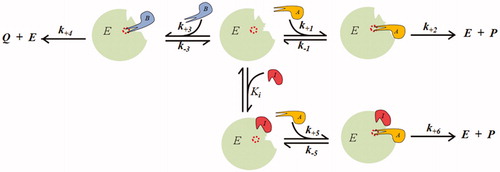
Figure 2. Predicted effect of a competitive DI on the transformation of two substrates catalysed by a multi-specific enzyme. The kinetic behaviour is described by the model reported in with the two substrates displaying the same KM (i.e. KA = KB = 5 concentration units) and the same kcat (100 time−1 units) and is represented by the Hanes–Wolff plot. Panel A: the transformation of substrate B, which is susceptible to inhibition, is analysed. The red open and closed circles refer to substrate B present alone and in the presence of A at a concentration equal to 2KM, respectively. Symbols ▪, ▲, ♦ and ▼refer to red closed circles in the presence of [I] equal to 1, 2, 3, and 5 times the Ki value, respectively. The Ki value is considered as KM/10. Panel B: the transformation of the substrate A, which is insensitive to direct inhibition, is analysed. Blue open and closed circles refer to substrate A alone and in the presence of B at a concentration equal to 2KM, respectively. Symbols ▪, ▲, ♦ and ▼ refer to blue closed circles in the presence of [I] equal to 0.5, 1, 2, and 5 times the Ki value, respectively. The Ki value is considered as KM/10. In Panels A and B, the increase in [I] is emphasised by the red arrows. In Panel C, the B rate transformation (red curve) and A rate transformation (blue curve) are reported as a function of the inhibitor concentration expressed as Ki fold. The substrate concentrations were considered fixed at the 2KM value and the Ki value is considered as KM/10. The dotted line refers to the differential inhibition.
![Figure 2. Predicted effect of a competitive DI on the transformation of two substrates catalysed by a multi-specific enzyme. The kinetic behaviour is described by the model reported in Figure 1 with the two substrates displaying the same KM (i.e. KA = KB = 5 concentration units) and the same kcat (100 time−1 units) and is represented by the Hanes–Wolff plot. Panel A: the transformation of substrate B, which is susceptible to inhibition, is analysed. The red open and closed circles refer to substrate B present alone and in the presence of A at a concentration equal to 2KM, respectively. Symbols ▪, ▲, ♦ and ▼refer to red closed circles in the presence of [I] equal to 1, 2, 3, and 5 times the Ki value, respectively. The Ki value is considered as KM/10. Panel B: the transformation of the substrate A, which is insensitive to direct inhibition, is analysed. Blue open and closed circles refer to substrate A alone and in the presence of B at a concentration equal to 2KM, respectively. Symbols ▪, ▲, ♦ and ▼ refer to blue closed circles in the presence of [I] equal to 0.5, 1, 2, and 5 times the Ki value, respectively. The Ki value is considered as KM/10. In Panels A and B, the increase in [I] is emphasised by the red arrows. In Panel C, the B rate transformation (red curve) and A rate transformation (blue curve) are reported as a function of the inhibitor concentration expressed as Ki fold. The substrate concentrations were considered fixed at the 2KM value and the Ki value is considered as KM/10. The dotted line refers to the differential inhibition.](/cms/asset/b4646b9c-15c4-4b03-848c-ef1f3c14dbef/ienz_a_1743988_f0002_c.jpg)
Figure 3. Effect of a competitive DI acting as a partial inhibitor of A transformation. The transformation rate of substrate B (red curve) and substrate A (blue curves) (see ) as a function of the inhibitor concentration (expressed as Ki fold) is reported. The substrate concentration is considered fixed at the KM value (KA = KB). Curves 1, 2, 3 and 4 refer to k+6 values equal to 0.8, 0.6, 0.4 and 0.2 times the k+2 value, respectively. The Ki value is considered as KM/10.
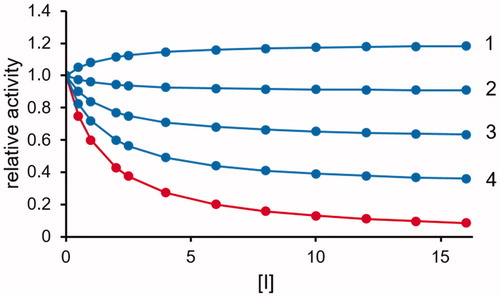
Figure 4. Non-competitive model of an intra-site differential inhibitor.
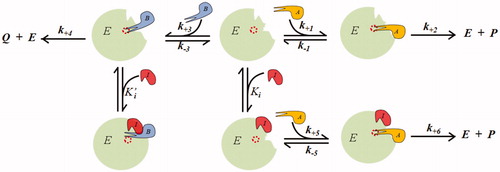
Figure 5. Effect of a non-competitive DI. The rate transformation of substrate B (open circles, see EquationEquation (5)(5)
(5) and substrate A (closed circles, see EquationEquation (4)
(4)
(4) according to the model of are reported as a function of the inhibitor concentration (expressed as lowest Ki fold). The substrates concentration is considered fixed at the KM value (KA = KB). The following combinations of inhibition constants are considered: red curves: Ki= KM/10 and K′i= KM; blue curves Ki= KM/10 and K′i = KM/5; green curves Ki= KM/5 and K′i= KM/10; violet curves Ki= KM and K′i= KM/10.
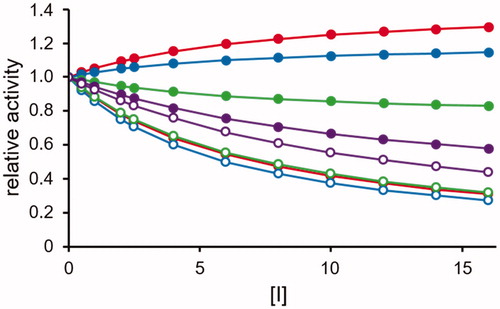
Figure 6. Differential inhibition of AKR1B1 by synthetic and natural compounds. The bars refer to the differential inhibition between aldoses reduction and HNE reduction. The letters along the bars refer to: a: D-glyceramideCitation15; b: D-gluconamideCitation15; c: pyrazol[1,5-a]pyrimidine derivative (compound 5e52); d: soyasaponinCitation55; e: NHDC20; f: sorbinilCitation52; g: epalrestatCitation52; h: [1,2,4]oxadiazol-5-yl-acetic acid derivative (compound 915); i: Saccharin derivative (compound 1615).
![Figure 6. Differential inhibition of AKR1B1 by synthetic and natural compounds. The bars refer to the differential inhibition between aldoses reduction and HNE reduction. The letters along the bars refer to: a: D-glyceramideCitation15; b: D-gluconamideCitation15; c: pyrazol[1,5-a]pyrimidine derivative (compound 5e52); d: soyasaponinCitation55; e: NHDC20; f: sorbinilCitation52; g: epalrestatCitation52; h: [1,2,4]oxadiazol-5-yl-acetic acid derivative (compound 915); i: Saccharin derivative (compound 1615).](/cms/asset/35f328c7-2a0a-4a2e-b87a-4c5b681c16ab/ienz_a_1743988_f0006_c.jpg)