
Figures & data
Scheme 1. Synthetic route of compounds (1‒25).
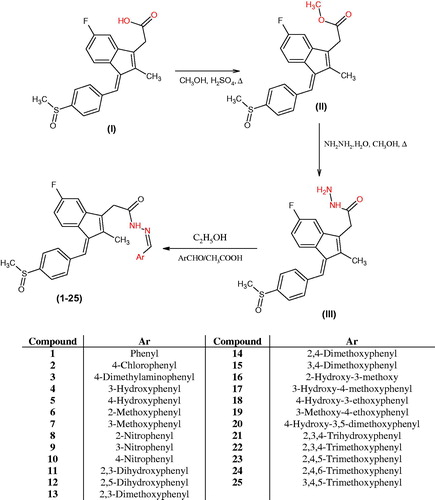
Figure 1. Comparison of DPPH scavenging activity of compounds (1–25) and BHT. All values are means of three replicates ± SD.
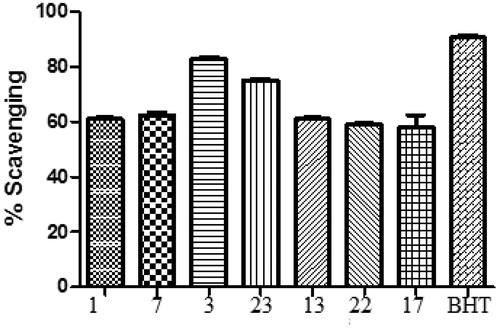
Table 1. Antioxidant activity of compounds (1–25) by DPPH method.
Table 2. Analgesic effect of drugs by Tail flick method in mice.
Table 3. Analgesic effect of drugs by Hot Plate method in mice.
Table 4. Analgesic effect of drugs by acetic acid-induced writhing in mice.
Table 5. Effect of compound 3 and sulindac on yeast-induced hyperthermia in mice.
Table 6. Anti-inflammatory activity of drugs by carrageenan-induced paw edoema method in albino rats.
Table 7. Ulcer study of drugs using 80% Ethanol.
Table 8. Ulcer study of drugs compared with Indomethacin
Table 9. Anti-oxidant activity, MDA, NP-SH and total protein of drugs in stomach tissue of rat.
Table 10. LD50 determination of compound 3.
Figure 2. Quantitative real-time PCR analysis for COX-2 mRNA expression in hepatocytes of treated and untreated rats with actin as housekeeping gene. Data analysed by one-way analysis of variance using graph pad prism 8. Asterisks **** indicate p < 0.0001 significance from control and vehicle group, ++++ indicates p < 0.0001 significance from cisplatin (CP 12 mg/kg) treated group and ## indicate p < 0.01 significance difference between CP + T (20 mg/kg) and CP + T (40 mg/kg) treatment groups. T stands for compound 3 treatment.
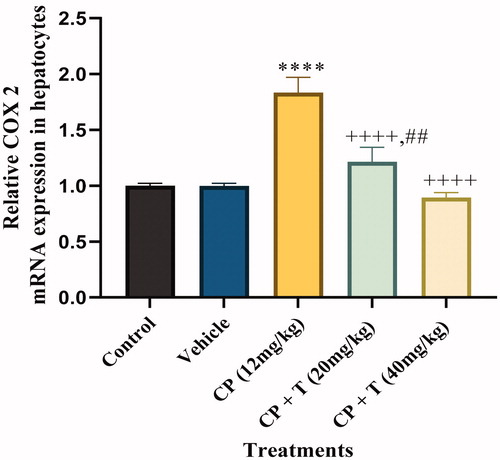
Figure 3. Effect of compound 3 treatment in regulating COX-2 protein expression in liver tissues of rats inoculated with cisplatin (12 mg/kg dose). Immunoblot analysis of COX-2 and β-actin in rat hepatocytes (n = 7). CP: cisplatin, T: compound 3 treatments.
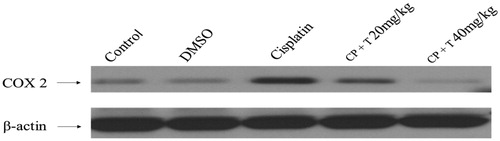
Figure 4. The orientation of docked compounds with Cox-2. The Sulindac is shown in blue colour while the compound 3 is shown in green colour. (A) The orientation of docked molecules is shown in sticks format. (B) The orientation of docked molecules is shown in spheres format.
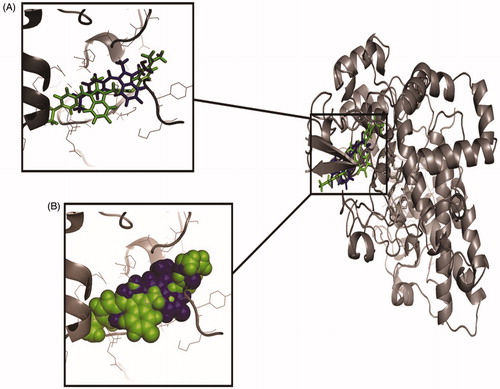
Figure 5. The orientation of Cox-2 residues making interactions with ligands (green) in 3 D confirmation. (A) The binding of drug Sulindac with Cox-2 protein. The amino acids residues are making hydrophobic interaction with drug. (B) The binding of compound 3 with Cox-2 protein. The amino acids residues are making two hydrogen bonds and hydrophobic interaction with the compound. (C) The Cys-32 and Tyr-116 making hydrogen bonds with compound 3.
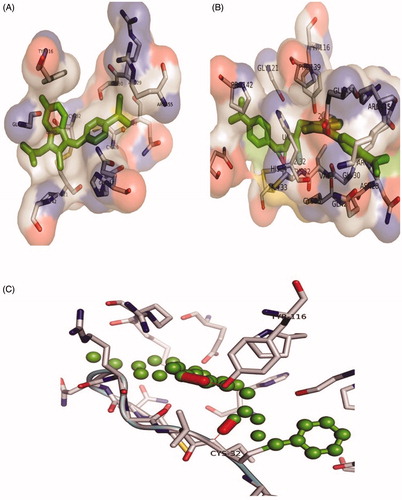
Figure 6. 2D map of interactions of Cox-2 protein with Sulindac (A) and compound 3 (B).
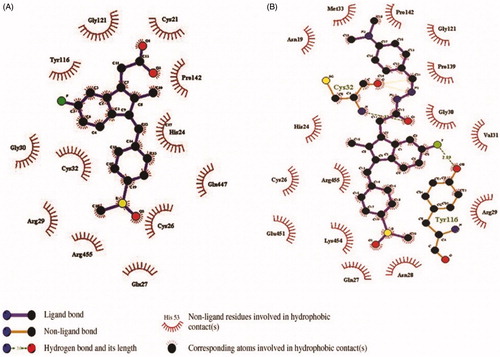
Table 11. Docking energies of compounds (1–25) and sulindac.
Data Availability
Samples of the compounds (1‒25) in pure form are available from authors.