Figures & data
Chart 1. Tariquidar and elacridar.
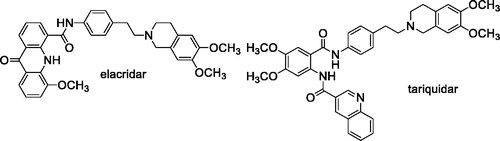
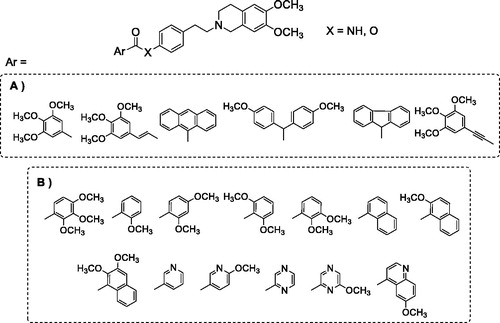
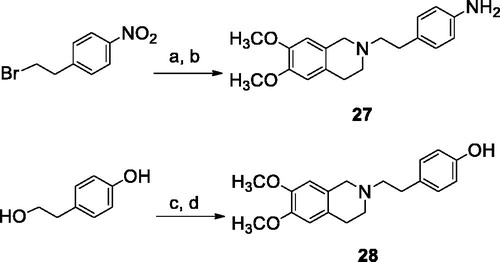
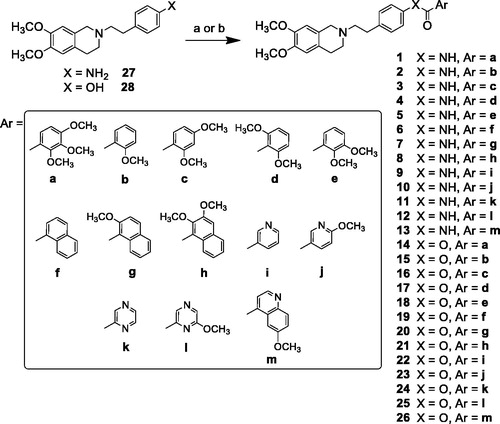
Figure 1. (A) Compounds described in the previous studyCitation34; (B) compounds synthesised in the present work.
Scheme 1. Reagents and conditions: (a) 6,7-dimethoxy-1,2,3,4-tetrahydroisoquinoline HCl, K2CO3, an. CH3CN; (b) H2, Pd/C, EtOH; (c) SOCl2, ethanol-free CHCl3, an. Et3N; (d) 6,7-dimethoxy-1,2,3,4-tetrahydroisoquinoline HCl, K2CO3, an. CH3CN.
Scheme 2. Reagents and conditions: (a) ArCOCl, ethanol-free CHCl3 or an. CH3CN; (b) ArCOOH, EDCI, DMAP, an. CH2Cl2 or CH3CN.
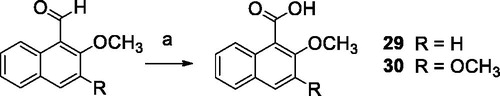
Scheme 3. Reagents and conditions: (a) R = H, CuBr2, t-BuOOH, an. CH3CN; R = OCH3, Na2CO3, KMnO4, acetone.
Scheme 4. Reagents and conditions: (a) H2SO4 (water sol. 10%), MnO2, CrO3, NH3 (15 N).
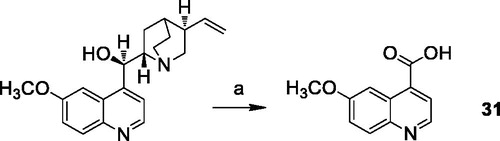
Table 1. MDR-reversing activity, P-gp interaction profile and calculated human plasma half-life of compounds 1–26.
Figure 2. In vitro cell growth experiments performed on MDCK-MDR1 cells in the presence of different concentrations of the two compounds 3 (A) and 8 (B). Each bar represents the mean ± SEM of two experiments performed in triplicate. One-way ANOVA analysis: ****p < 0.0001.
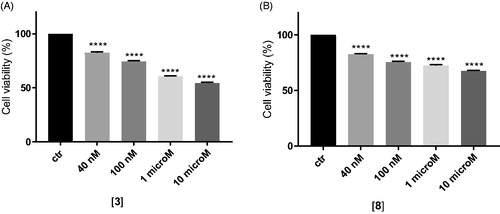
Figure 3. In vitro cell growth experiments performed on MDCK-MDR1 cells in the presence of 10 μM doxorubicin (Doxo) alone and in the presence of different concentrations of the tested compounds 3 (A) and 8 (B). Each bar represents the mean ± SEM of two experiments performed in triplicate. One-way ANOVA analysis: ****p < 0.0001.
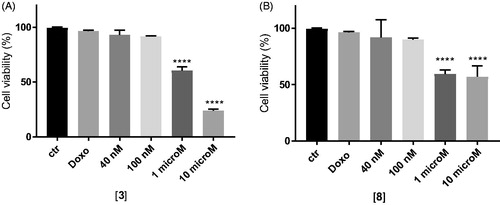
Figure 4. In vitro cell growth experiments performed on HT29 (A), HT29/DX cells (B), A549 (C) and A549/DX cells (D) in the presence of compound 3 alone at different concentrations and in co-administration of 10 μM doxorubicin (Doxo) (after the dotted line). Each bar represents the mean ± SEM of two experiments performed in triplicate. CTR represents the untreated cells, while ctr is the same cell lines treated with 10 μM Doxo alone. One-way ANOVA analysis: *p < 0.05; **p ≤ 0.005; ****p ≤ 0.0001.
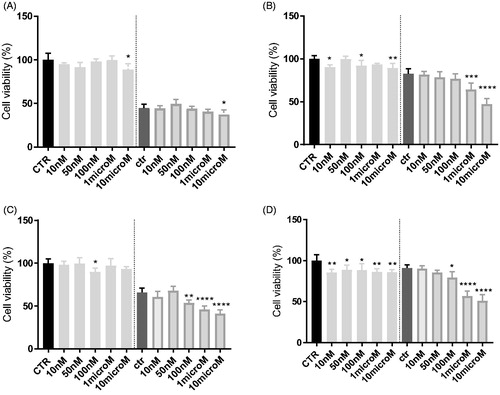
Figure 5. In vitro cell growth experiments performed on HT29 (A), HT29/DX cells (B), A549 (C) and A549/DX cells (D) in the presence of compound 8 alone at different concentrations and in co-administration of 10 μM doxorubicin (Doxo) (after the dotted line). Each bar represents the mean ± SEM of two experiments performed in triplicate. CTR represents the untreated cells, while ctr is the same cell lines treated with 10 μM Doxo alone. One-way ANOVA analysis: *p < 0.05; **p ≤ 0.005; ***p ≤ 0.001; ****p < 0.0001.
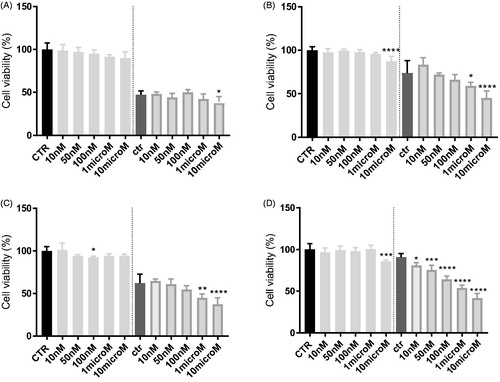
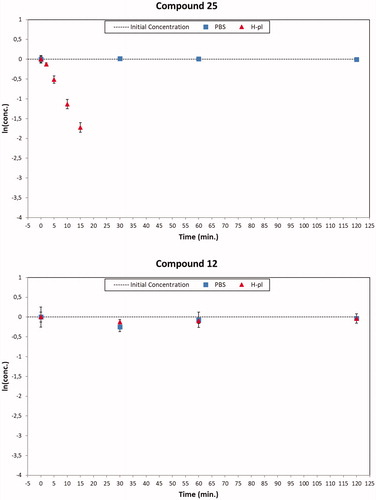
Figure 6. Degradation plots of the ester compound 25 (top) and the corresponding amide derivative 12 (bottom) in PBS (square blue) and human plasma (red triangle) samples. The ester compound 25 suffered a quickly enzymatic hydrolysis (t1/2 about 6 min), while the amide derivative 12 was stable over 120 min in human plasma samples. Both the concentration profiles resulted unmodified in PBS solutions.