Figures & data
Figure 1. Structure of JMV5038, SAR studies from referencesCitation10 andCitation11 and new studied modulations.
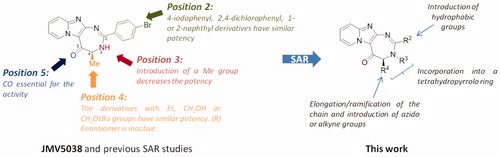
Figure 2. Correlations between IC50, determined in two melanoma cell lines, and molecular volume of compounds modified in position R2 (A and B) or between IC50 and cLogP (C and D). ▪: A375 cell line; ◆: MDA-MB-435 cell line; r: Pearson’s correlation coefficient, p values: level of significance, n: sample size; the dotted line separates the most active compounds (IC50 < 15 µM) from the less active ones (IC50 > 15 µM), except for compound 9’ (see the text).
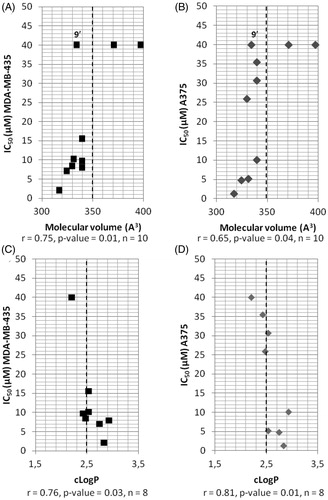
Table 1. Structure and IC50 values of compounds on the A375, MDA-MB-435 and NIH-3T3 cell lines.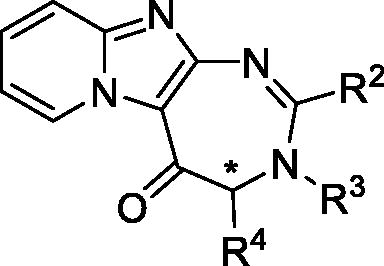
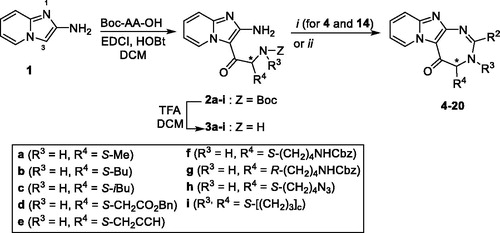
Scheme 1. Synthesis of pyrido-imidazodiazepinones 4–20. Conditions and reagents: Boc-AA-OH: Boc-Ala-OH, Boc-Nle-OH, Boc-Leu-OH, Boc-Asp(Bn)-OH, Boc-Pra-OH, Boc-Lys(Cbz)-OH, R-Boc-Lys(Cbz)-OH, Boc-azidonorleucine 29 or Boc-Pro-OH; i: 1. NH4OH, H2O; 2. R2CHO, CHCl3, 60 °C; 3. DDQ, rt; ii: R2CHO, K2CO3, I2, THF, 65 °C. For compounds 4–20, R2, R3 and R4 substituents are referenced in .
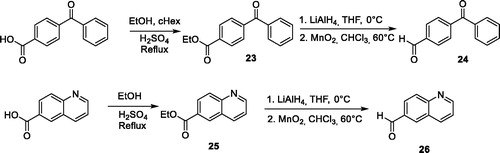
Scheme 2. Synthesis of aldehydes 24 and 26.
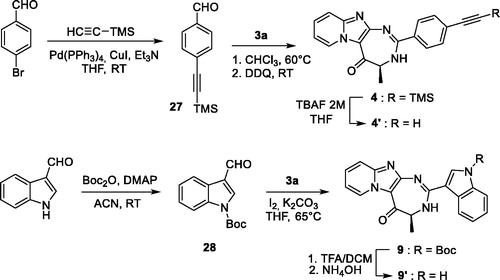
Scheme 3. Synthesis of compounds 4’ and 9’.
Scheme 4. Synthesis of compounds 16 and 22.
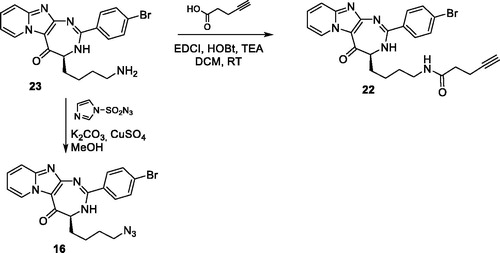
Table 2. Some calculated physicochemical parameters of compounds modified on position 2.
Figure 3. Correlation 3 D-plot between calculated molecular volume, cLogP and cytotoxic activity of compounds modified in position R2 (mean of IC50 determined on MDA-MB-435 and A375 melanoma cell lines).
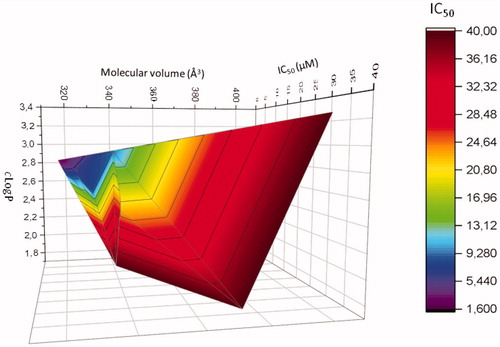
Figure 4. Evaluation of in vitro anti-cancer activity of JMV5038, compounds 5, 8 and 16 on the NCI-60 cell line panel, after 48 h of exposure at a single dose of 10 µM of each tested compound. Presented results are cell growth level determined for the 4 compounds on the 27 most JMV5038 sensitive cell lines (i.e. mean growth % – growth % > 0). For all data (60-cell lines), see Table S1, SI. The difference between the growth level of a specific cell line and the mean growth is represented by a bar. Cell lines that were more sensitive are displayed as bars that project to the right of the mean. Cell lines that were less sensitive are displayed with bars projected to the left.
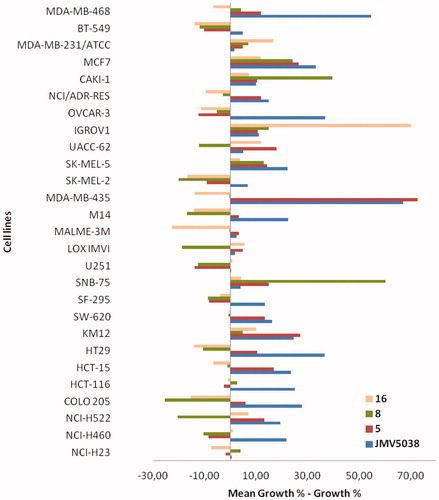
Figure 5. Flow cytometric analyses showing the cell cycle distribution of MDA-MB-435 cells treated with DMSO or 5 µM concentration of compound 5 or 8 for 16 h or 48 h. The panels represent distribution of cells (%) in Sub G1-, G1-, S-, G2/M- phase of the cell cycle.
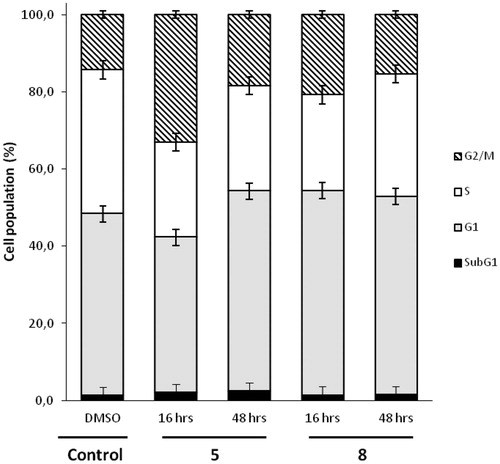
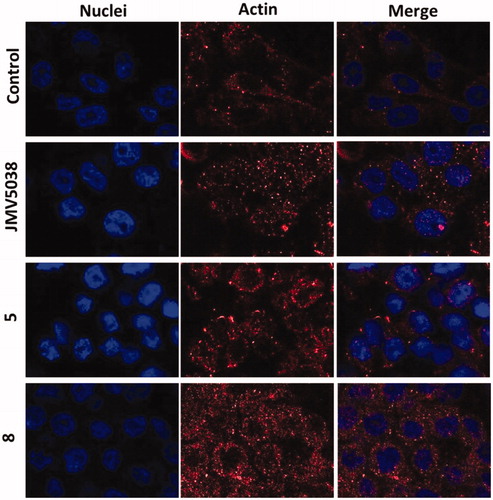
Figure 6. Confocal microscopy of actin localised in fixed MDA-MB-435 cells. Cells were incubated with 5 µM concentration of JMV5038, compound 5, compound 8 or DMSO (control) for 20 h. Nuclei were stained with Hoechst 33342. AlexaFluor568 and nuclei were excited at 543 and 405 nm, and visualised at 620 (red) and 450 nm (blue) respectively.