Figures & data
Figure 1. Chemical structure and pharmacological properties of the most active 1,2,4-triazole-3-thione derivativesCitation11,Citation13–15.
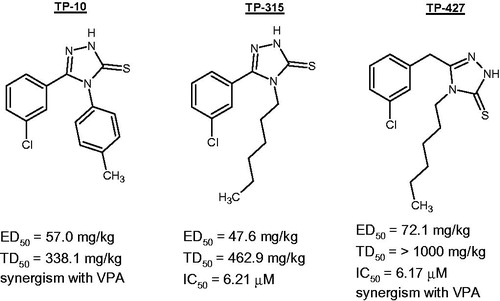
Table 1. Quantitative analysis of the anticonvulsant potential of compounds TP-10, TP-315 and TP-427 in the mouse 6 Hz seizure test.
Table 2. Antioxidant activity of TP-10, TP-315, and TP-427 determined using single-electron transfer (SET)-based methods (DPPH, CUPRAC)
Figure 2. Viability of U-87 MG cells exposed to a fixed concentration of TP-10, TP-315, and TP-427.
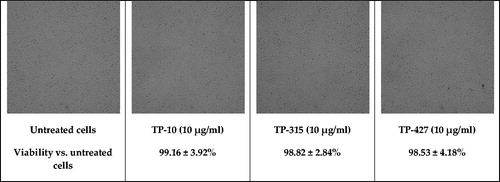
Figure 3. Flow cytometric analysis of U-87 MG cells treated for 24 h with TP-10, TP-315, TP-427 (red histogram) for total ROS activity. Control (untreated) cells are shown as black histogram. Mean percentage values from three independent experiments done in duplicate are presented (*p < 0.05 vs. control group).
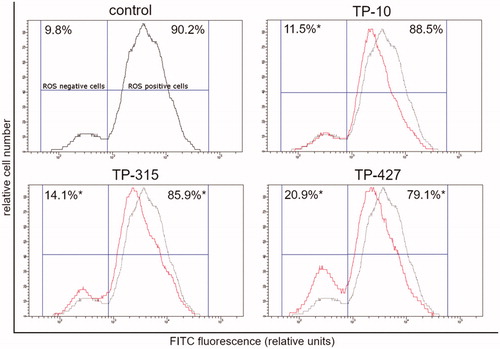
Figure 4. Changes of mitochondrial membrane potential of U-87 MG cells treated for 24 h with the investigated compounds (10 μg/ml). The x- and y-axes are green and red fluorescence, respectively. Mean percentage values from three independent experiments done in duplicate are presented (*p < 0.05 vs. control group).
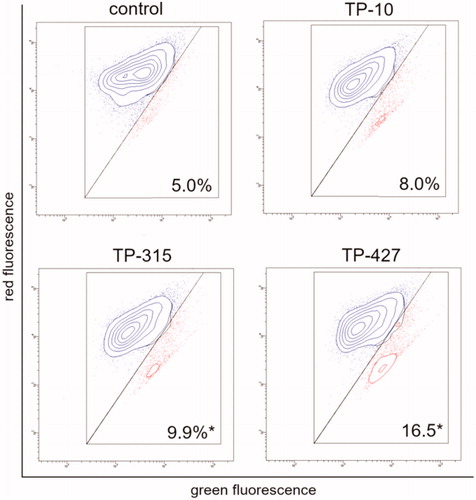
Table 3. Inhibitory effect of TP-10, TP-315, and TP-427 against human carbonic anhydrases I and II.
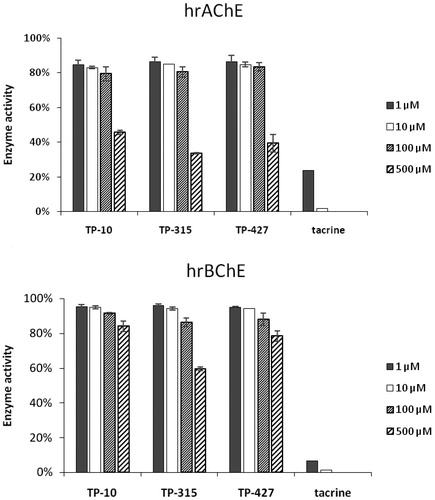
Figure 5. Inhibitory effect of TP-10, TP-315, TP-427 and tacrine against human recombinant acetylcholinesterase (upper graph) and butyrylcholinesterase (lower graph).