Figures & data
Table 1. The Q column experiments.
Figure 1. The specific enzyme activities of BpKdsB, BtKdsB, and PaKdsB. The enzyme activities with (a–c) different concentrations of CTP in the presence of 0.25 mM KDO and (d–f) different concentrations of KDO in the presence of 0.1 mM CTP.
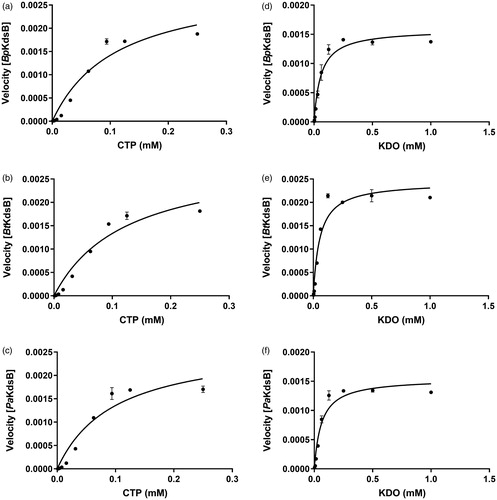
Table 2. The KdsBs kinetics parameters.
Figure 2. A dose-dependent inhibitory curve for the inhibition of (a) BpKdsB, (b) BtKdsB, and (c) PaKdsB by Rose Bengal.
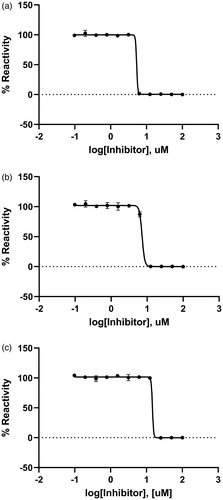
Figure 3. The inhibitory enzyme kinetics of KdsB from Pseudomonas aeruginosa (PaKdsB). The enzyme activities with (a) different concentrations of CTP in the presence of 0.25 mM KDO and (b) different concentrations of KDO in the presence of 0.1 mM CTP. Filled circles represent the inhibitory enzyme kinetics with DMSO and squares for with 14.66 µM Rose Bengal in (a). Filled circles represent the inhibitory enzyme kinetics with DMSO and triangles for with 14.66 µM Rose Bengal in (b).
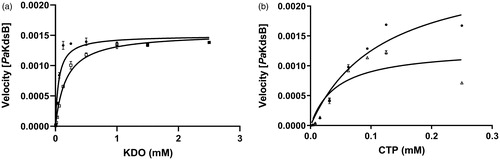
Figure 4. A predicted docking mode of Rose Bengal in the catalytic site of PaKdsB. (a) The docking pose of Rose Bengal was depicted on the electrostatic surface potential of PaKdsB (red, negative; blue, positive; white, uncharged). The enlarged view of the active site docked with Rose Bengal was depicted with dot lines. In addition, (b) a 2D schematic representation of the docked Rose Bengal with PaKdsB was drawn. Figures were created with Maestro v11.5.011. The dot line represents the ion interaction by Arg160 and Arg185 and the arrow represents the hydrogen bond interaction with Asn95, Gln100, and Gly188.
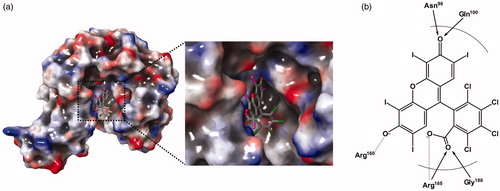
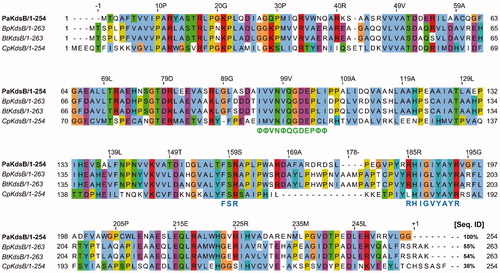
Figure 5. Sequence alignment of PaKdsB with the rest of three KdsBs. Pa: Pseudomonas aeruginosa; Bp: Burkholderia pseudomallei; Bt: Burkholderia thailandensis; Cp: Chlamydia psittaci. The highly conserved motifs were indicated. Green letters mean the nucleotide binding motif in the catalytic cavity. Blue letters mean the substrate binding motifs. The % sequence identity was calculated with PaKdsB as a reference sequence. The consensus amino acid ID coloured according to the Clustal X colour scheme provided by the Jalview programCitation37.