Figures & data
Figure 1. Structure of Furagin.
Scheme 1. Reagents and conditions: i. RCHO, EtOH, RT, 16 h
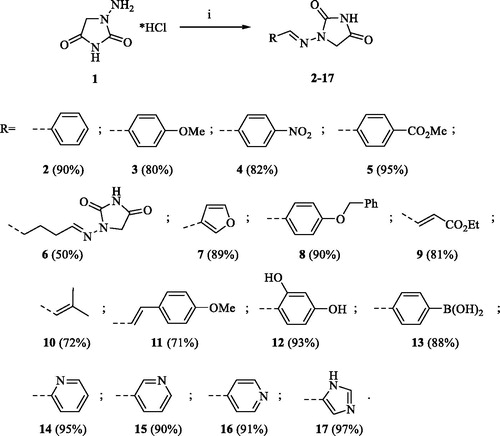
Table 1. Inhibition data of human CA isoforms CA I, II, IX, and XII with aminohydantoines (2–17, Furagin) using AAZ as a standard inhibitor.
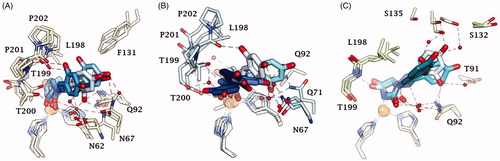
Figure 2. Predicted docking orientations of 7 (green) and Furagin (pink) to (A) CA II, (B) CA IX and (C) CA XII.
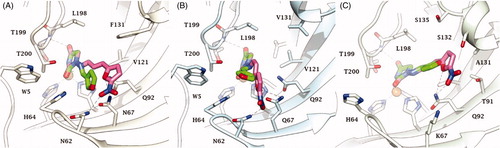
Figure 3. RMSD analysis of Furagin heavy atoms and (A) CA II, (B) CAIX and (C) CA XII backbone over the 100 ns MD simulation. The ligand colour darkens over the dynamic simulation.
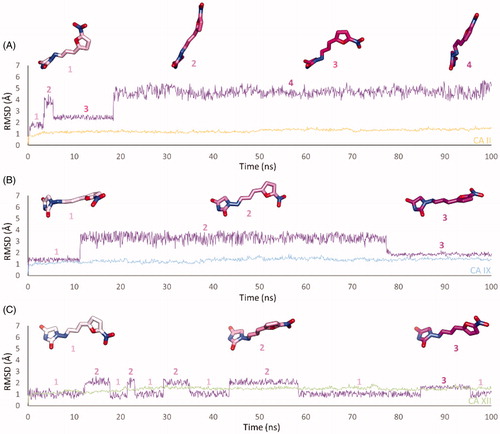
Figure 4. Dynamics evolution of the binding mode of Furagin to (A) CA II, (B) CA IX and (C) CA XII over the course of 100 ns. Water molecules are represented as red spheres. The ligand colour darkens over the dynamic simulation.
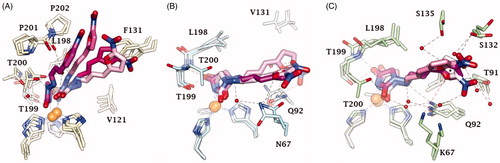
Figure 5. RMSD analysis of 12 heavy atoms and (A) CA II, (B) CAIX and (C) CA XII backbone over the 100 ns MD simulation. The ligand colour darkens over the dynamic simulation.
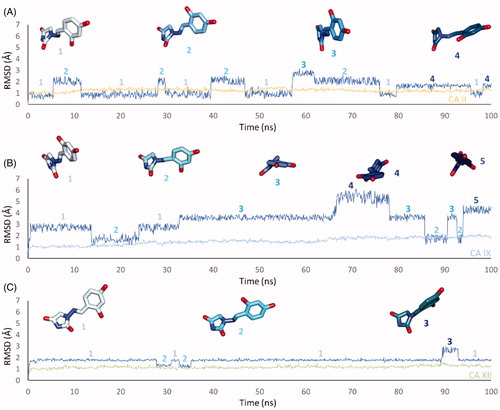
Figure 6. Dynamics evolution of the binding mode of 12 to (A) CA II, (B) CA IX and (C) CA XII over the course of 100 ns. Water molecules are represented as red spheres. The ligand colour darkens over the dynamic simulation.