Figures & data
Figure 1. The example skeleton structures of flavonoids. Ten different scaffolds classified in this study were displayed with example flavonoid derivatives. Basic skeletons and their carbon atoms numbering pattern were drawn.
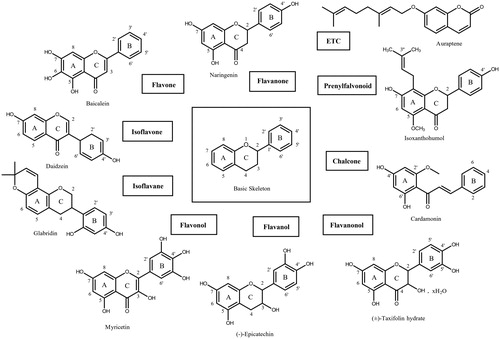
Figure 2. Results from the FRET method. Each data point represents the effect of myricetin against ASFV protease compared to the control. The RFU are plotted against the log-concentration of inhibitory compounds. Each dot is expressed as the mean ± standard error of the mean (n = 3). RFU: Relative Fluorescence Units.
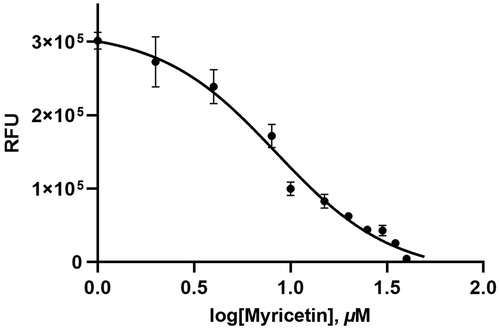
Figure 3. Fluorescence quenching spectra of ASFV protease. A solution containing 1 μM ASFV protease showed a strong fluorescence emission (the solid line) with a peak at 340 nm at the excitation wavelength of 295 nm. After adding 20 μM (the dashed line) and 40 (one dotted line) μM inhibitory compound, fluorescence quenching spectra were obtained.
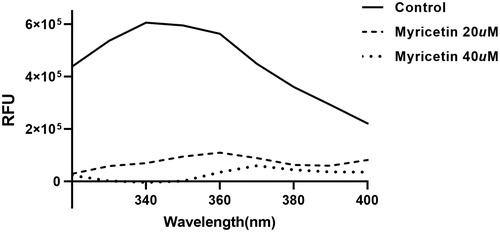
Figure 4. Schematic representation of flavonols. Structures of inhibitory compounds discussed in this study were listed and the positions of substituted hydroxyl groups were demonstrated. Since they belong to the flavonol family, the hydroxyl group at the carbon atom position 3 is conserved. In myricitrin and quercitrin, the L-rhamnoside moiety was placed instead of the hydroxyl group.
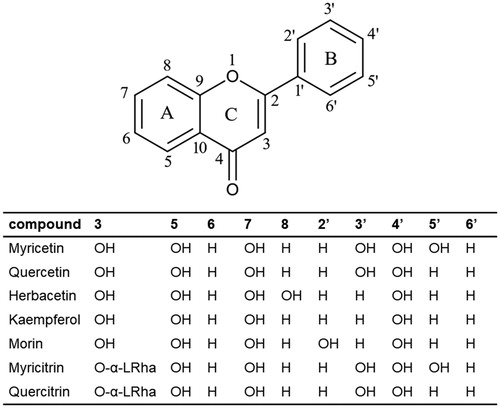
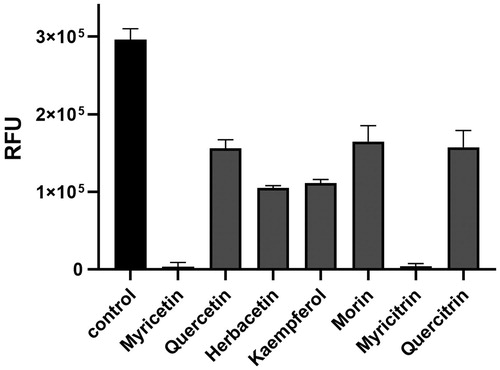
Figure 5. The effects of flavonoids on the ASFV protease activity. Each bar represents the inhibitory activity of compounds with 0.01% Triton X-100. The first black bar represents the control. Inhibitory compounds were used at 40 μM concentration. Each bar is expressed as the mean ± standard error of the mean (n = 3). RFU: Relative Fluorescence Units.