9,760
Views
61
CrossRef citations to date
0
Altmetric
Review Article

Advances in the discovery of exosome inhibitors in cancer

ORCID Icon, ORCID Icon, , &
Pages 1322-1330 | Received 02 Dec 2019, Accepted 07 Apr 2020, Published online: 16 Jun 2020

Figures & data

Table 1. RAB27A inhibitors.

Figure 1. The interactions between Tipifarnib and RAB27A from molecular docking. (A) The pocket is shown in electrostatics representation. (B) The two-dimensional schematic representation of the Rab27a and Tipifarnib complex interactions. Red, yellow, blue and white ribbons: RAB27A. The binding surfaces are identified in grey. The molecular structures of Tipifarnib is displayed by purple ball-and-stick models. Green lines indicate pi-pi stacking interactions, and purple dashed arrows represent sidechain hydrogen bond interactions. Polar and hydrophobic residues are depicted with green and pink circles, respectively.

Figure 1. The interactions between Tipifarnib and RAB27A from molecular docking. (A) The pocket is shown in electrostatics representation. (B) The two-dimensional schematic representation of the Rab27a and Tipifarnib complex interactions. Red, yellow, blue and white ribbons: RAB27A. The binding surfaces are identified in grey. The molecular structures of Tipifarnib is displayed by purple ball-and-stick models. Green lines indicate pi-pi stacking interactions, and purple dashed arrows represent sidechain hydrogen bond interactions. Polar and hydrophobic residues are depicted with green and pink circles, respectively.

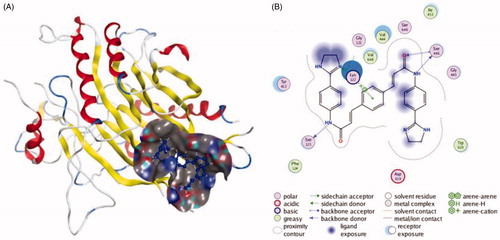
Figure 2. The interactions between GW4869 and nSMase from molecular docking. (A) The pocket is shown in electrostatics representation. (B) The two-dimensional schematic representation of the nSMase and GW4869 complex interactions. Red, yellow, blue and white ribbons: nSMase. The binding surfaces are identified in grey. The molecular structures of GW4869 is displayed by purple ball-and-stick models. Green lines indicate pi-pi stacking interactions, and purple dashed arrows represent sidechain hydrogen bond interactions. Polar and hydrophobic residues are depicted with green and pink circles, respectively.

Figure 2. The interactions between GW4869 and nSMase from molecular docking. (A) The pocket is shown in electrostatics representation. (B) The two-dimensional schematic representation of the nSMase and GW4869 complex interactions. Red, yellow, blue and white ribbons: nSMase. The binding surfaces are identified in grey. The molecular structures of GW4869 is displayed by purple ball-and-stick models. Green lines indicate pi-pi stacking interactions, and purple dashed arrows represent sidechain hydrogen bond interactions. Polar and hydrophobic residues are depicted with green and pink circles, respectively.

Table 2. nSMase inhibitors.

Table 3. Other inhibitors.
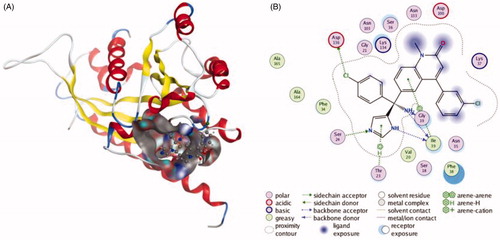
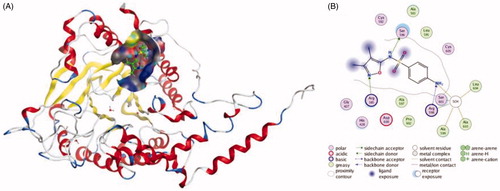
Figure 3. The interactions between Sulphisoxazole and endothelin receptor A from molecular docking. (A) The pocket is shown in electrostatics representation. (B) The two-dimensional schematic representation of the endothelin receptor A and Sulphisoxazole complex interactions. Red, yellow, blue and white ribbons: endothelin receptor A. The binding surfaces are identified in grey. The molecular structures of Sulphisoxazole is displayed by purple ball-and-stick models. Green lines indicate pi-pi stacking interactions, and purple dashed arrows represent sidechain hydrogen bond interactions. Polar and hydrophobic residues are depicted with green and pink circles, respectively.

Figure 3. The interactions between Sulphisoxazole and endothelin receptor A from molecular docking. (A) The pocket is shown in electrostatics representation. (B) The two-dimensional schematic representation of the endothelin receptor A and Sulphisoxazole complex interactions. Red, yellow, blue and white ribbons: endothelin receptor A. The binding surfaces are identified in grey. The molecular structures of Sulphisoxazole is displayed by purple ball-and-stick models. Green lines indicate pi-pi stacking interactions, and purple dashed arrows represent sidechain hydrogen bond interactions. Polar and hydrophobic residues are depicted with green and pink circles, respectively.