Figures & data
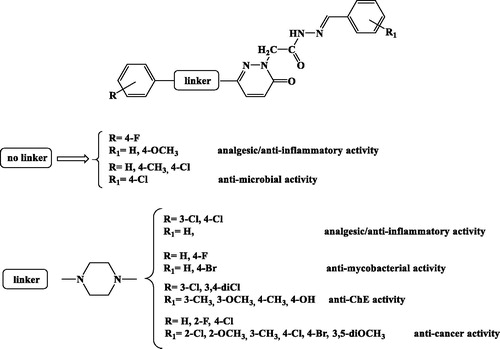
Figure 1. Structure-activity relationships (SARs) within the 3(2H)-pyridazinone derivatives reported in the literature.
Scheme 1. Synthesis of compounds VIa-o. Reagents and conditions: (i) AlCl3, CS2; (ii) H2NNH2, EtOH, reflux (6 h); (iii) Br2, CH3COOH, reflux (overnight); (iv) BrCH2COOCH2CH3, K2CO3, acetone, reflux (overnight); (v) H2NNH2.H2O, MeOH, rt; (vi) EtOH, reflux (6 h), nonsubstituted/substitutedbenzaldehyde.
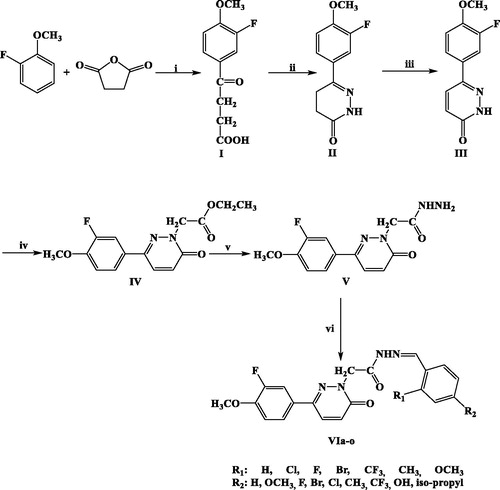
Table 1. Molecular structures, yields and melting points of VIa–o.
Figure 2. Effects of serotonin (5-HT) in the range 10 pg/mL − 1 µg/mL on colon cancer HCT116 cell viability (MTT test). Data are means ± SE and analysed through analysis of variance (ANOVA), followed by post hoc Newman-Keuls test. ANOVA, p < 0.01; post hoc, *p < 0.05 vs. CTR (control) group.
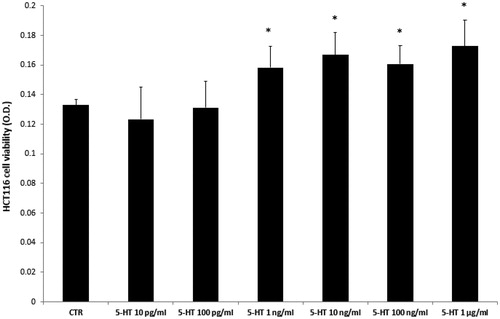
Figure 3. Effects of compounds VIa–o at 10 µg/mL on serotonin (5-HT)-induced colon cancer HCT116 cell viability (MTT test). Data are means ± SE and analysed through analysis of variance (ANOVA), followed by post hoc Newman-Keuls test. ANOVA, p < 0.0001; post hoc, *p < 0.05, **p < 0.01, ***p < 0.001 vs. 5-HT (serotonin) group.
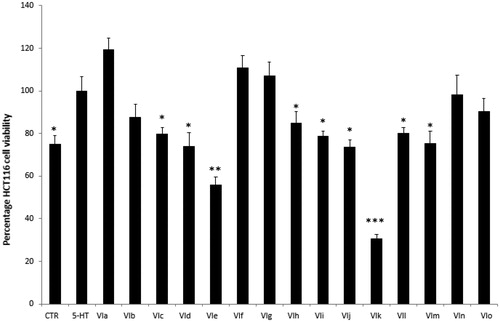
Figure 4. Effects of compounds VIa–o at 10 µg/mL on serotonin (5-HT)-induced reduction of kynurenic acid (KA) release from colon cancer HCT116 cells. Data are means ± SE and analysed through analysis of variance (ANOVA), followed by post hoc Newman-Keuls test. ANOVA, p < 0.0001; post hoc, *p < 0.05, **p < 0.01, ***p < 0.001 vs. 5-HT (serotonin) group.
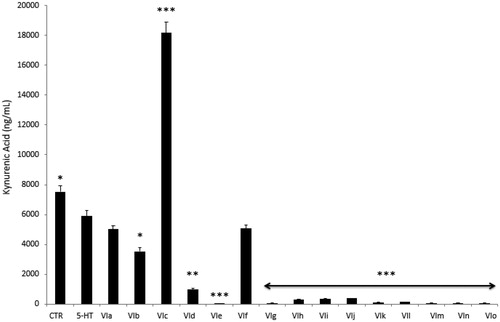
Figure 5. Effects of compounds VIc, VIe, VIk and daunorubicin at 0.1–20 µg/mL on HCT116 cell viability. Data are means ± SE and analysed through analysis of variance (ANOVA), followed by post hoc Newman-Keuls test. ANOVA, p < 0.0001; post hoc, *p < 0.05, **p < 0.01, ***p < 0.001 vs CTR (control) group.
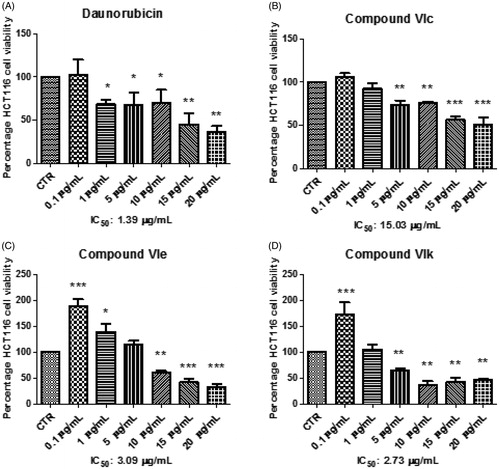
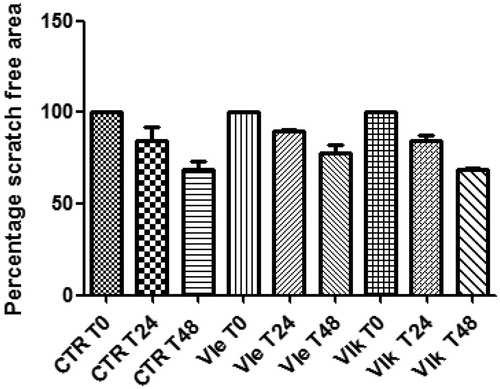
Figure 6. Effects of compounds VIe (3.09 µg/mL) and VIk (2.73 µg/mL) on the spontaneous migration of human colon cancer HCT116 cell line (wound healing paradigm). The spontaneous migration was monitored in the 48 h following treatment. Data are expressed as percentage scratch area relative to the untreated CTR group.