Figures & data
Figure 1. Graphical representation of the nucleotide sequence and translated amino acid sequence of BteCAι. The open reading frame (ORF) is indicated by bold capital letters, while the two nucleotide strands (5′ and 3′) by lower-case letters. The dark box (top of the figure) contains the amino acid residues identified as the protein signal peptide. The lightbox (bottom of the picture) contains the three histidines motifs, which is a unique characteristic of the ι-CA, and thus, not present in the other CA-classes reported up to now.
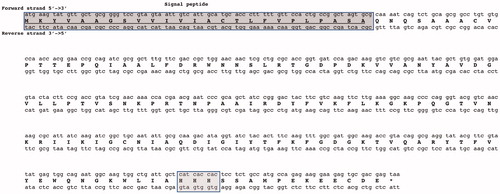
Figure 2. Graphical output generated by the software SignalP 4.1. The graph shows three different scores for the first 70 amino acid residues of BteCAι. Legend: X-axis, amino acid position; Y-axis, the following three scores: C-score (red line), raw cleavage site score; S-score (green line), signal peptide score; Y-score (blue line), combined cleavage site score.
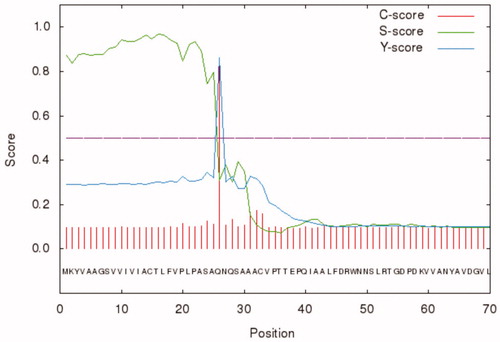
Figure 3. Alignment of BteCAι and LCIP63. The peptide signal (in red) are enclosed for both proteins. In the case of LCIP63, only the first domain of the four repeated domains was considered. The grey box represents the common consensus of the ι-CAs.
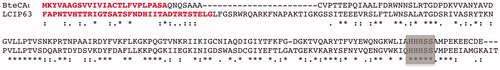
Figure 4. Phylogenetic analysis was carried out using the PhyML programme. The bootstrap consensus tree (100 replicates) was obtained using all four classes of CAs identified in the genome of different bacteria. The two human α-CA isoforms hCA I and II were included in the phylogenetic analysis, too. Legend: α-cluster (pink), β-cluster (yellow), γ-cluster (light blue), and ι-cluster (dark blue).
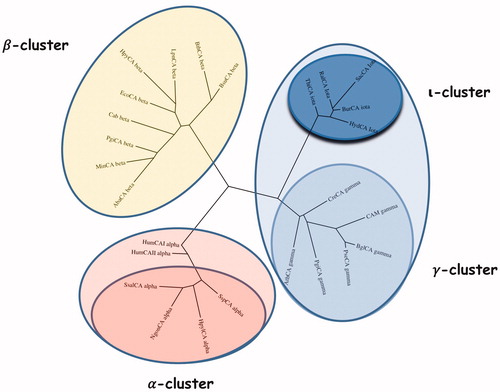
Figure 5. Combined lanes of SDS-Page and Western blot of BteCAι. The affinity purified recombinant BteCAι was subjected to SDS-PAGE (Lane 1) and then electro-blotted and incubated with the anti-HisTag (Lane 2, Panel A). Lane Std, molecular markers.
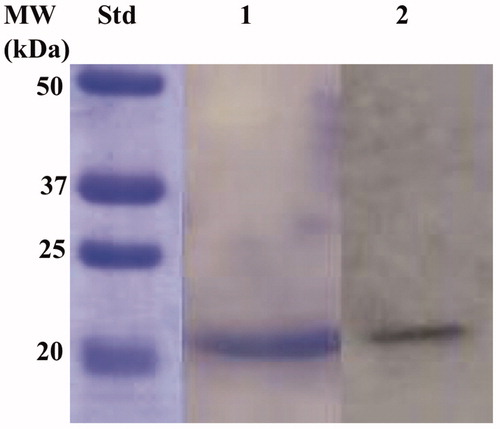
Figure 6. Developed protonogram showing the CO2 hydratase activity of BteCAι. The purified bacterial ι-CA was mixed with the Loading Solution Buffer (LSB) containing SDS at different concentrations (1.0, 0.5 and 0.1%) and loaded on the gel at 10 µg/well. The yellow bands correspond to the enzyme activity responsible for the drop of pH from 8.2 to the transition point of the dye in the control buffer. Legend: Lane 1, BteCAι with 1% SDS (protein in a monomeric state, MW: 19.0 kDa); Lane Std, Molecular markers. Lane 2 and 3 purified BteCAι mixed with 0.5 and 0.1% SDS, respectively (monomer and dimer); Lane 4, commercial bovine CA, used as positive controls.
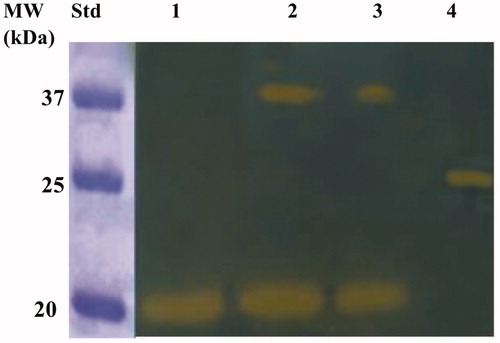
Table 1. BteCAι kinetic parameters compared with those calculated for the two human isoforms hCA I and II (α-class), and the α-, β-, γ- and ι-CAs from different bacterial species (all of them with Zn(II) at the active site).
Figure 7. Output generated by the bioinformatics programme IonCom using as query sequence the BteCAι amino acid polypeptide chain. The output evidenced the ions not detected for the binding (point 1); and the possible ions, such as Zn2+ and Ca2+ (points 2 and 3). Besides, it reports the BteCAι amino acid sequence with the binding residues indicated in red.
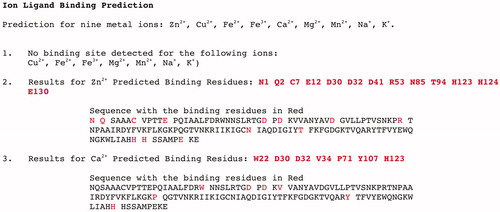
Table 2. Effect of the addition of the Zn2+, Ca2+, and Mg2+ on the activity of the EDTA-treated BteCAι.
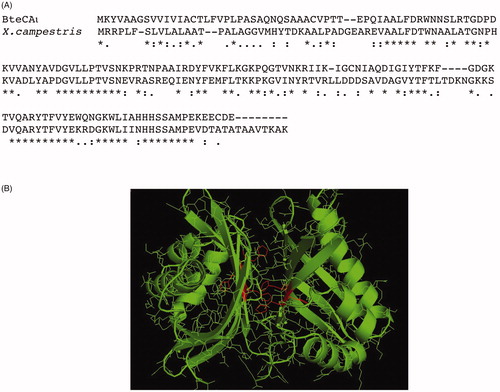
Figure 8. Panel A: Alignment of the amino acid sequences from B. territory and X. campestris. Panel B: Model of the bacterial BteCAι generated using the automated procedure on the server SWISS-MODEL (https://swissmodel.expasy.org).