Figures & data
Figure 1. Role of aldose reductase in diabetic complications.
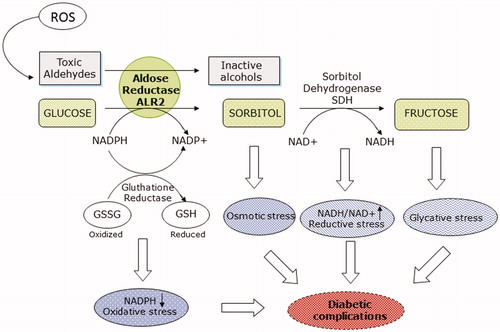
Figure 2. Structures of ARIs from different structural classes.
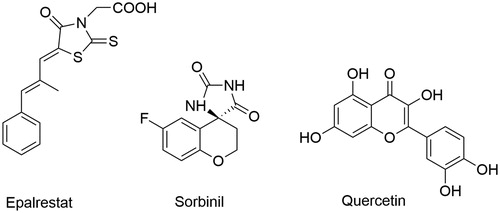
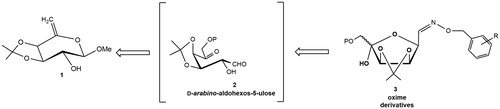
Figure 3. Retrosynthetic approach to the oxime derivatives 3.
Scheme 1. Reagents and conditions: (i) MCPBA, dry CH2Cl2, rt, 2 h and then anhydrous KF (6a: 65% yield from 1).
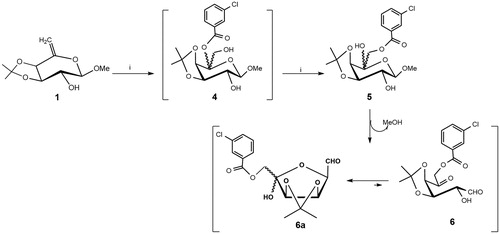
Table 1. Selected 1H NMR data (δ, ppm) of d-arabino-aldohexos-5-ulose derivative 6a and of arylmethyloxyimino derivatives 8–11.
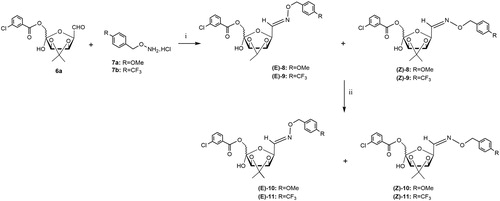
Scheme 2. Reagents and conditions: (i) 3:1 CHCl3-H2O, 60 °C, 4 h (E/Z-8: 38%); or 3:1 CHCl3-H2O, MW irradiation, 40 °C, 20 min (E/Z-8: 65%; E/Z-9: 60%); (ii) NaBH4, dry MeOH, rt, 1 h, and then at 40 °C, 1 h (E/Z-10: 70%; E/Z-11: 63%).
Scheme 3. Reagents and conditions: (i) 7a, NaBH3CN, MeOH, 60 °C, 96 h (12: 20%; E/Z-8: 10%; E/Z-10: 40%) or 7a, NaBH3CN, MeOH, AcOH, 60 °C, 96 h, (12: 15%; E/Z-8: 12%; E/Z-10: 43%) or 7a, NaBH3CN, MeOH, AcOH, MW irradiation, 40 °C, 30 min, (12: 25%; E/Z-8: 22%; E/Z-10: 11%).
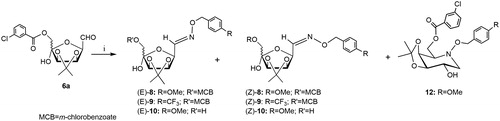
Table 2. Selected 13 C NMR data (δ, ppm) of d-arabino-aldohexos-5-ulose derivative 6a and of arylmethyloxyimino derivatives 8–11.
Table 3. Aldose Reductase (ALR2) inhibitory data of compounds 8–11 and 12.
Figure 4. The histogram shows results obtained for the inhibition of ALR2 by using a specific kit assay after incubation with compound (Z)-8. Values are calculated as percentage of maximum activity measured in hyperglycaemic control Ctrl-HG) and are reported as mean ± SEM (n = 3, independent experiments). The values shown for the Ctrl-NG and Ctrl-HG correspond to those present in the previous work of the same authorsCitation15 because the molecules of the two works were evaluated in a single screening.
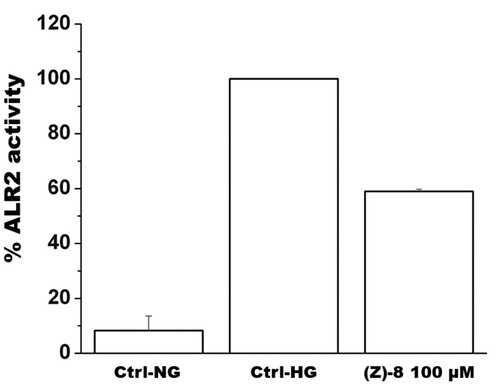
Figure 5. Effectiveness of compound (Z)-8 in increasing cell viability. (A) The histogram shows that while the hyperglycaemic condition impairs significantly cell viability, compared to the normoglicemic control (Ctrl-NG), treatment with (Z)-8 at both 50 and 100 µM concentrations recovers the level of cell viability, even significantly at 100 µM. (B) Histograms show results obtained for apoptotic pathway inhibition. It is important to note that the level of apoptotic process is significantly reduced after the treatment with both 50 and 100 µM of (Z)-8. Values were reported as mean ± SEM (n = 3, independent experiments); t-test *p < 0.05, **p < 0.01. The values shown for the Ctrl-NG and Ctrl-HG correspond to those present in the previous work of the same authorsCitation15 because the molecules of the two works were evaluated in a single screening.
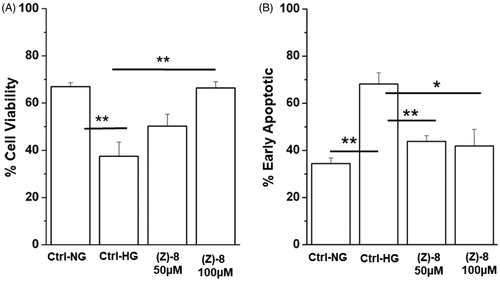
Figure 6. Antioxidant activity of compound (Z)-8. The micrograph obtained with the florescence microscope showed the specific staining for Nrf2 (green) and the nuclear staining obtained with ethidium bromide (red). The arrows indicate the different localisation of Nrf2, cytosolic in both normoglycemic conditions and after the treatment with 100 µM (Z)-8, while it is nuclear (yellow-orange marking, co-localisation) in hyperglycaemic conditions.
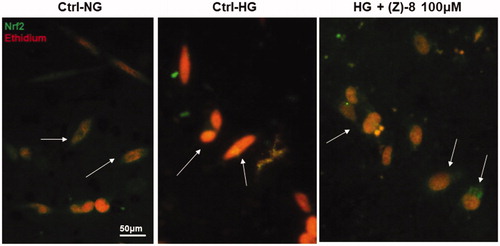
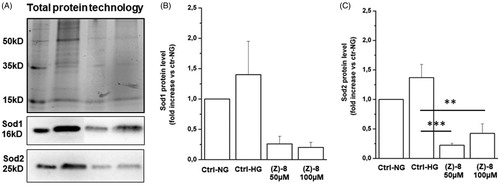
Figure 7. (A) Representative image of a western blotting experiment. Contents of Sod1 and Sod2 were normalised for total protein content by using the Stain Free Technology (BioRad). The graph bar shows the protein levels of the antioxidant enzyme Sod1. The treatment with (Z)-8 is effective in decreasing protein levels in respect to either Ctrl-NG or Ctrl-HG, in a dose-dependent manner. (C) The graph bar shows the protein levels of the antioxidant enzyme Sod2. In this case, the treatment with (Z)-8 is effective in significantly decreasing protein levels in respect to either Ctrl-NG or Ctrl-HG. Values are reported as mean ± SEM (n = 3, independent experiments); t-test **p < 0.01, ***p < 0.001. The values shown for the Ctrl-NG and Ctrl-HG correspond to those present in the previous work of the same authorsCitation15 because the molecules of the two works were evaluated in a single screening.