Figures & data
Figure 1. Structure of representative IDO1 clinical candidates.
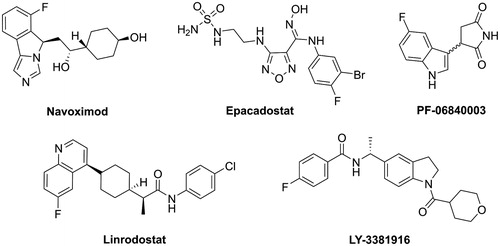
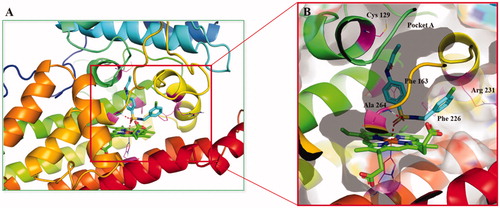
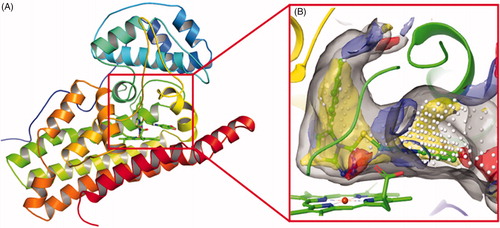
Figure 2. (A) The co-crystal of IDO1 (PDB ID: 4PK5). (B) Site maps generated using Sitemap: the ligand was Amg-1, white points represented the new identified active region, as well as yellow, blue and red solid maps represented hydrophobic regions, hydrogen bond donors and acceptors, respectively.
Scheme 1. Reagents and conditions: (a) TEA, DCM, 0 °C, rt; (b) HCl, ethanol, 70 °C; (c) Acryloyl chloride, TEA, DCM, 0 °C, rt.
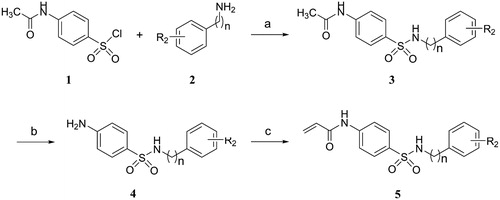
Scheme 2. Reagents and conditions: (a) Acryloyl chloride, TEA, DCM, 0 °C, rt; (b) HSO3Cl, 70 °C, 1 h; (c) Substituted aniline, pyridine, DCM, 0 °C, rt.
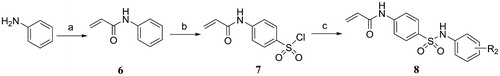
Table 1. IDO1 inhibitory activity of the target compounds 3a-i, 4a-f, 5a-e and 8a-b.
Table 2. IDO1 inhibitory activity of the target compounds 5f-m and 8c-j.
Figure 3. Compounds 3d, 5d, 5l and 8g did not affect the expression of IDO1 protein. (A) HeLa cells were treated with IFN-γ (100 ng/mL) for 24 h, then incubated with or without test compounds at their IC50 concentrations for 24 h, and expression of IDO was analysed by Western blot using an anti-IDO antibody. (B) The greyscale scanning statistical results of A. (C) HeLa cells were incubated with compound 5d (3, 10, 30 μM) for 24 h. (D) The greyscale scanning statistical results of C. (E) HeLa cells were incubated with compound 5d (3, 10, 30 μM) for 48 h. (F) The greyscale scanning statistical results of E. Data are presented as means ± SEM (n = 3).
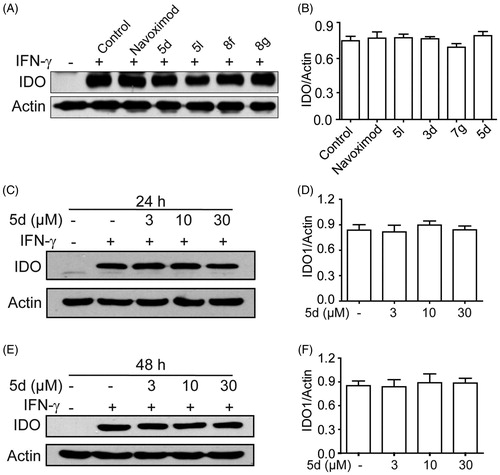
Figure 4. Compounds 5d and 8 g could promote the proliferation of T cells. Based on the B16F1-T cell co-culture system, use MTT assay to test T cells proliferation. The Navoximod and compounds were added to the system at the concentration of 1.5 and 18 μM. Data represent mean ± SEM (n = 3).
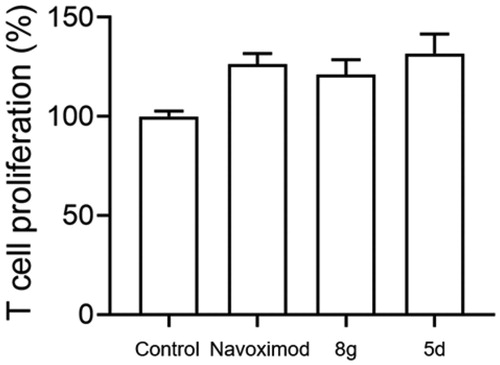
Figure 5. Compounds 5d and 8 g inhibited Treg cell differentiation in the cell co-culture system. (A) After co-cultured with B16F1 cells, T cells were collected. Surface staining was performed with CD4+ FTTC and CD25+ PE for 30 min at 4 °C. The cells were fixed and permeabilized with fixation buffer and permeabilization wash buffer. The intracellular staining was performed with FoxP3+ APC for 20 min. The cells were then analysed by flow cytometry analysis. (B) Statistical analysis of result A. Data are represented as ± SEM (n = 3). *p < 0.05, **p < 0.01 vs T + B16F1.
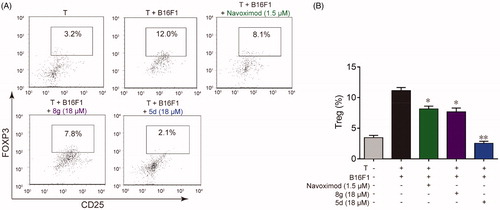
Figure 6. Compound 5d could bind to IDO1 protein in HeLa cells. HeLa cells were treated with human IFN-γ (100 ng/mL) for 24 h, and then treated with 5d for 2 h. The cells were collected and subjected to CETSA assay. The levels of IDO1 protein were assessed by Western blot analysis.
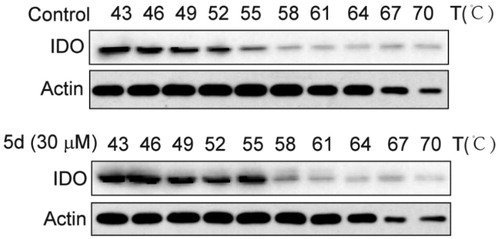
Figure 7. Compound 5d suppressed colon cancer growth in immunocompetent mice. 1 × 10⁶ CT26 cells were transplanted subcutaneously into the armpit of the BALB/c mice. Three days after transplantation, mice were randomly allocated to vehicle control or treatment groups (n = 10). Drugs were administered on days 1–14. Tumour volume (A) and mice body weight (B) were recorded. After sacrifice, solid tumours were separated and weighed (C, D). Data represent mean ± SEM, n = 10, *p < 0.05, **p < 0.01 vs vehicle.
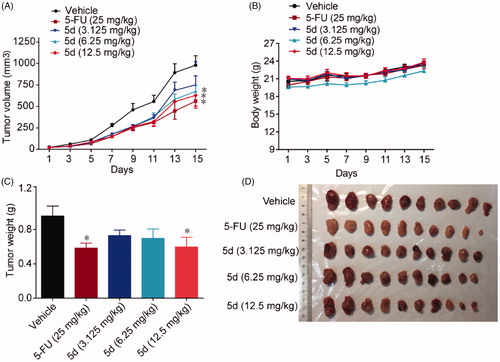
Figure 8. Compound 5d did not suppress the growth of CT26 tumour in nude mice. 1 × 10⁶ CT26 cells were transplanted subcutaneously into the armpit of immunodeficient BALB/c nude mice. Three days after transplantation, mice were randomly allocated to vehicle control or treatment groups (n = 8). Drugs were administered on days 1–9. (A) Tumour volume and mouse body weight (B) were recorded. After sacrifice, solid tumours were separated and weighed (C, D). Data represent mean ± SEM, n = 8, *p < 0.05, **p < 0.01 vs vehicle.
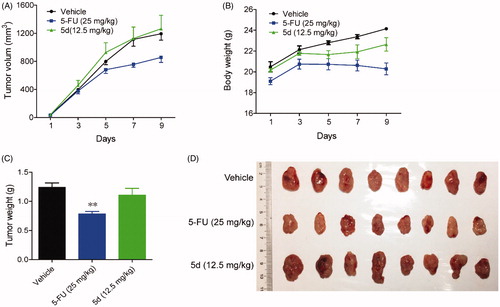
Figure 9. Compound 5d dose-dependently reduced tumour cells and induced apoptosis in mice. The tumour tissues were infused in formaldehyde solution for paraffin section. (A) H&E staining of tumour tissue. (B) Expression of PCNA. (C) TUNEL staining of tumour sections. Scale bar: 50 μm.
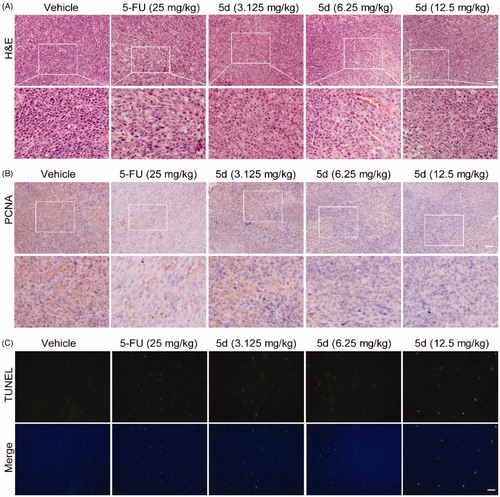
Figure 10. Compound 5d could not suppress the proliferation of tumour cells in immunodeficient mice. Tumour sections were infused in formaldehyde solution for immunohistochemistry. (A) H&E staining of tumour tissue. (B) Expression of PCNA. Scale bar: 50 μm.
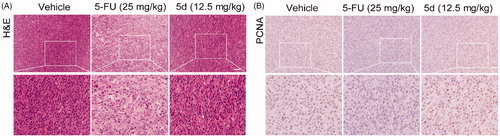
Figure 11. Compound 5d up-regulated the expression of IFN-γ and granzyme B. Tumour sections were infused in formaldehyde solution for immune stain. (A) Expression of IFN-γ. (B) Expression of Granzyme B. Scale bar: 50 μm.
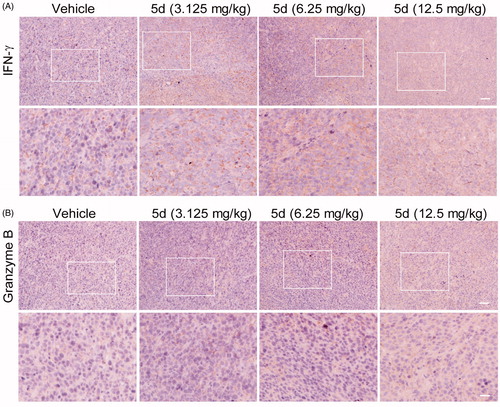
Figure 12. Compound 5d decreased Treg cell differentiation in the CT26 tumour-bearing mouse. (A) Decreased differentiation of Treg cells in the spleen of tumour-bearing mice treated by compounds. (B) Statistical analysis of result A. Data represent mean ± SEM, *p < 0.05 vs vehicle.
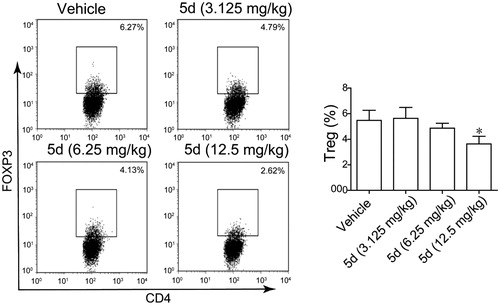
Figure 13. Compound 5d suppressed melanoma growth in mice. 1 × 10⁶ melanoma cells were transplanted subcutaneously into the armpit of the BALB/c mice. Three days after transplantation, mice were randomly allocated to vehicle control or treatment groups (n = 6). Drugs were administered on days 1–11. (A) Tumour volume and mouse body weight (B) were recorded. After sacrifice, solid tumours were separated and weighed (C, D). Data represent mean ± SEM, n = 6, *p < 0.05, **p < 0.01 vs vehicle.
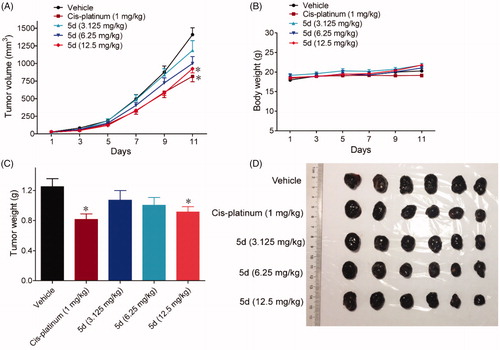
Figure 14. Compound 5d dose-dependently reduced tumour cells and induced apoptosis in mice. Tumour sections were infused in formaldehyde solution for immunohistochemistry. (A) H&E staining of tumour tissue. (B) Expression of PCNA. (C) TUNEL staining of tumour sections. Scale bar: 50 μm.
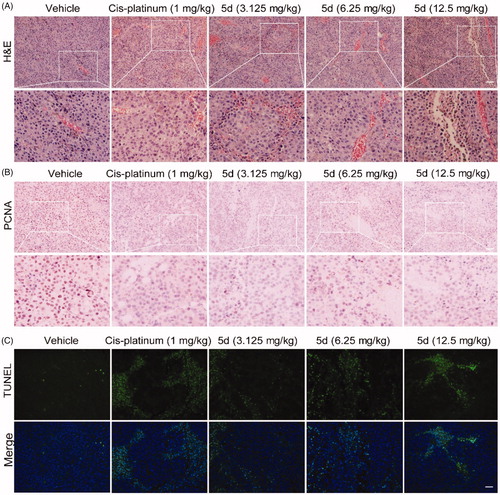
Figure 15. Compound 5d promoted T cells activation while reduced Foxp3+ Treg cell number in tumour tissue. Tumour sections were infused in formaldehyde solution for immune stain. (A) Expression of IFN-γ. (B) Expression of Granzyme B. Scale bar: 50 μm.
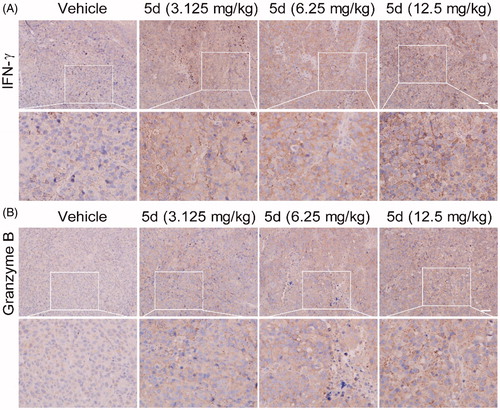
Figure 16. (A) Proposed binding mode of compound 5d docked into the crystal structure of human IDO1 (PDB: 4PK5) by IFD methods. (B) The interactions between compound 5d and IDO1. Polar interactions were presented by red dotted line.