1,735
Views
9
CrossRef citations to date
0
Altmetric
Research Paper

Prognostic value of CAIX expression in oral squamous cell carcinoma: a systematic review and meta-analysis

ORCID Icon, ORCID Icon, ORCID Icon, ORCID Icon, ORCID Icon, ORCID Icon, ORCID Icon & ORCID Icon show all
Pages 1258-1266 | Received 17 Apr 2020, Accepted 11 May 2020, Published online: 29 May 2020

Figures & data

Figure 1. Flowchart for inclusion of the studies according to the PRISMA guidelines.

Figure 1. Flowchart for inclusion of the studies according to the PRISMA guidelines.

Figure 2. Forest plot for the association of higher CAIX expression with overall survival (A), disease‐free survival (B).

Figure 2. Forest plot for the association of higher CAIX expression with overall survival (A), disease‐free survival (B).

Table 1. Characteristics of the included studies.

Table 2. Synthesis of data extracted from the included studies related to outcomes pooled in the meta‐analysis.

Table 3. Quality score according to the REMARK guidelines.

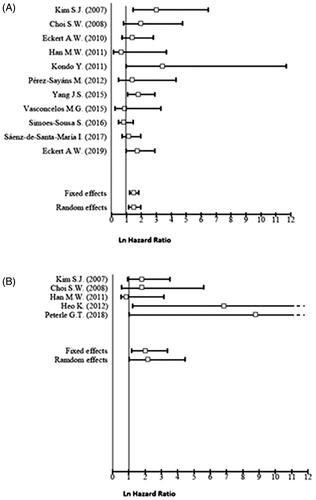
Table 4. Pooled hazard ratios and 95% confidence intervals.

Figure 3. Funnel plot of publication bias for higher CAIX expression and overall survival.

Figure 3. Funnel plot of publication bias for higher CAIX expression and overall survival.