Figures & data
Table 1. Plants tested in this study, including their botanical name, family, organ/s used, voucher number, percentage of tyrosinase (Tyr IA %). and elastase inhibitory (Ela IA %) activity at 50 μg/mL, total phenolics (TPC) and flavonoids (TFC) content expressed in µg of gallic acid (GA) equivalent/mg of extract and µg of rutin (R) equivalent/mg of extract respectively.
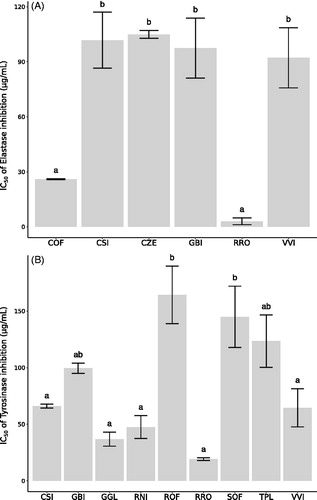
Figure 1. IC50 values of tyrosinase inhibition (A) and IC50 values of elastase inhibition (B) obtained for the most active extracts. Different letters within the same assay indicate significant differences in ANOVA test (p < 0.05). Results are expressed ad means ± SD of three independent experiments. COF: Ceterach officinarum DC.; CSI: Camellia sinensis Kuntze; CZE: Cinnamomum zeylanicum Nees; GBI: Ginkgo biloba L.; GGL: Glycyrrhiza glabra L.; RNI: Ribes nigrum L.; ROF: Rheum officinale Baill.; RRO: Rhodiola rosea L.; SOF: Salvia officinalis L.; TPL: Tilia platyphyllos Scop.; VVI: Vitis vinifera L.