1,557
Views
19
CrossRef citations to date
0
Altmetric
Original Article

Biochemical and structural characterisation of a protozoan beta-carbonic anhydrase from Trichomonas vaginalis

, , , , , , , ORCID Icon, ORCID Icon, ORCID Icon, & ORCID Icon show all
Pages 1292-1299 | Received 20 Apr 2020, Accepted 18 May 2020, Published online: 09 Jun 2020

Figures & data

Figure 1. Illustration of the pBVboostFG expression vector. The designed parts of the insert: 1. attL1, 2. Shine-Dalgarno, 3. Kozak, 4. Met-Ser-Tyr-Tyr, 5. 6 × His, 6. Asp-Tyr-Asp-Ile-Pro-Thr-Thr, 7. Lys-Val, 8. CA gene of interest, 9. 2 × stop codon, 10. attL2.

Figure 1. Illustration of the pBVboostFG expression vector. The designed parts of the insert: 1. attL1, 2. Shine-Dalgarno, 3. Kozak, 4. Met-Ser-Tyr-Tyr, 5. 6 × His, 6. Asp-Tyr-Asp-Ile-Pro-Thr-Thr, 7. Lys-Val, 8. CA gene of interest, 9. 2 × stop codon, 10. attL2.

Table 1. Data collection and refinement statistics

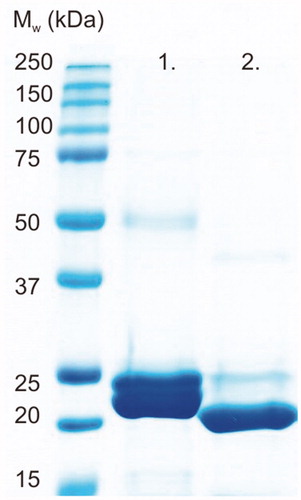
Figure 2. SDS-PAGE of purified TvaCA1 with a 6xHis-tag (lane 1) and after removal of the tag (lane 2). All the polypeptide bands shown on the gel were identified as TvaCA1 protein by MS/MS. The standard molecular weight (Mw) marker is shown on the far left.

Figure 2. SDS-PAGE of purified TvaCA1 with a 6xHis-tag (lane 1) and after removal of the tag (lane 2). All the polypeptide bands shown on the gel were identified as TvaCA1 protein by MS/MS. The standard molecular weight (Mw) marker is shown on the far left.

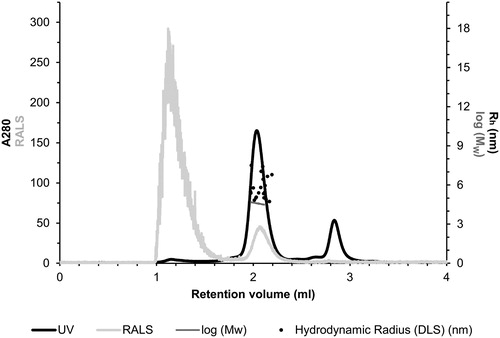
Figure 3. Light scattering data for the assessment of the oligomeric state and size of TvaCA1. The left Y-axis shows the UV absorption intensity at 280 nm and right-angle light scattering intensity (RALS). The right Y-axis shows the Mw calculated using static LS intensity.

Figure 3. Light scattering data for the assessment of the oligomeric state and size of TvaCA1. The left Y-axis shows the UV absorption intensity at 280 nm and right-angle light scattering intensity (RALS). The right Y-axis shows the Mw calculated using static LS intensity.

Table 2. Kinetic data of TvaCA1. For comparison, kinetic parameters of hCA I, hCA II, and other representative β-CA enzymes are shown.

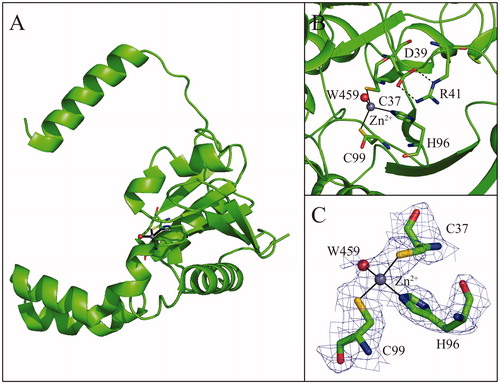
Figure 4. (A) Ribbon representation of the TvaCA1 monomer. (B) Enlarged view of the active site, showing Zn2+ coordination. (C) σA-weighted |2Fo-Fc| electron density map (contoured at 1.0 σ) relative to zinc ion coordination site.

Figure 4. (A) Ribbon representation of the TvaCA1 monomer. (B) Enlarged view of the active site, showing Zn2+ coordination. (C) σA-weighted |2Fo-Fc| electron density map (contoured at 1.0 σ) relative to zinc ion coordination site.

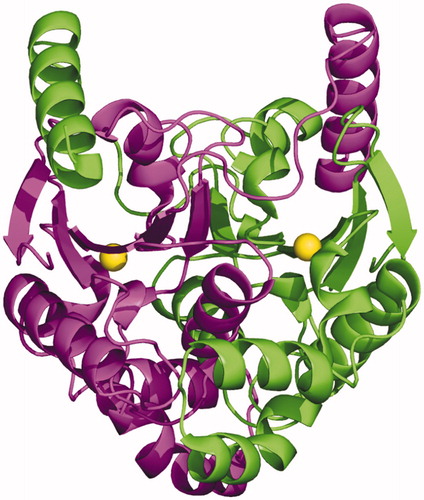
Figure 5. Dimeric structure of TvaCA1, with one monomer coloured in magenta and the other in green. The catalytic zinc ions are depicted as yellow spheres.

Figure 5. Dimeric structure of TvaCA1, with one monomer coloured in magenta and the other in green. The catalytic zinc ions are depicted as yellow spheres.

Table 3. β-CAs whose crystal structure has been determined
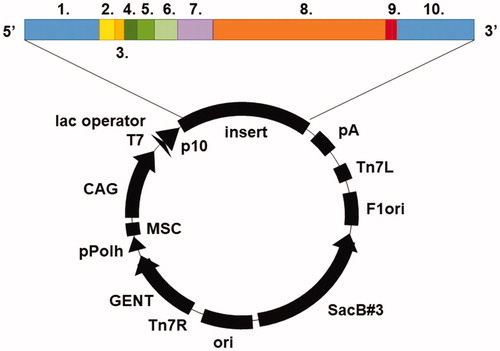
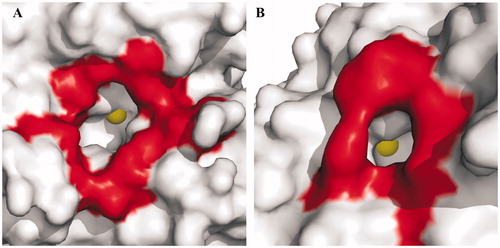
Figure 6. Surface representation of (A) hCA II, chosen as a representative hCA isoform, and (B) TvaCA1. Residues delimiting the rim of the active site cavity are coloured in red. The metal ions are shown as yellow spheres. It is evident that in hCA II, the active site rim is larger (approximately 15 Å × 14 Å) and more accessible than that in TvaCA1 (8 Å × 6.5 Å).

Figure 6. Surface representation of (A) hCA II, chosen as a representative hCA isoform, and (B) TvaCA1. Residues delimiting the rim of the active site cavity are coloured in red. The metal ions are shown as yellow spheres. It is evident that in hCA II, the active site rim is larger (approximately 15 Å × 14 Å) and more accessible than that in TvaCA1 (8 Å × 6.5 Å).