Figures & data
Figure 1. Relative activity of EcGUS in the presence of different compounds at 100 μM. The β-glucuronidase inhibitor DSL (D-glucaric acid-1,4-lactone) was used as a positive control. All data were expressed as mean ± standard deviation of triplicate reactions.
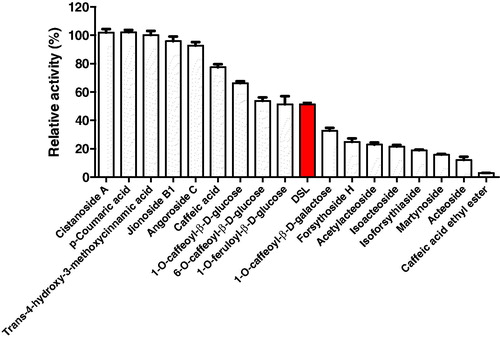
Table 1. Chemical structures of cinnamic acid derivatives and inhibition of EcGUS-mediated pNPG hydrolysis.
Figure 2. Dose-dependent curves of EcGUS inhibitors. (A) Acteoside, acetylacteoside, caffeic acid ethyl ester, and isoforsythiaside; (B) Isoacteoside, martynoside, forsythoside H, caffeic acid, and D-glucaric acid-1,4-lactone. Data were expressed as mean ± standard deviation of triplicate experiments.
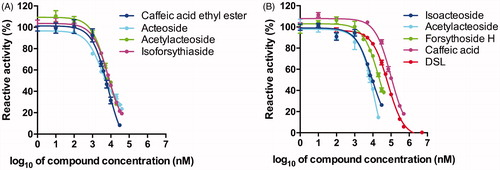
Figure 3. Lineweaver-Burk plots of (A) acteoside, (B) martynoside, (C) isoacteoside, (D) acetylacteoside, (E) isoforsythiaside, and (F) caffeic acid ethyl ester as EcGUS inhibitors. All data were expressed as mean ± standard deviation of triplicate experiments.
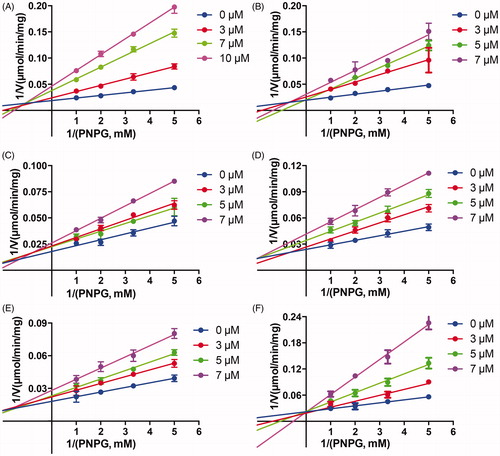
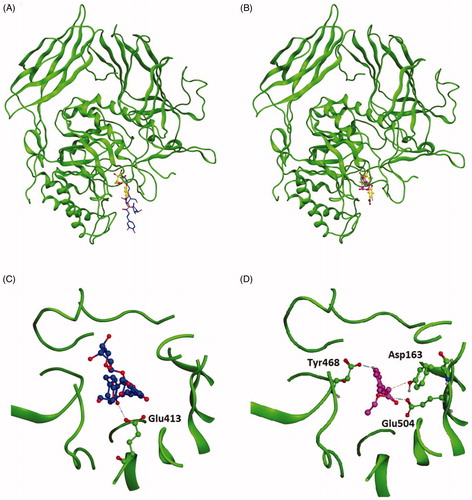
Figure 4. Stereoview of the 3D structure of EcGUS and a stereodiagram of pNPG bound to (A) acteoside or (B) caffeic acid ethyl ester in the active site (pocket 1) of EcGUS. Detailed view of (C) acteoside and (D) caffeic acid ethyl ester in the active site of EcGUS.